Grace M. Davis High School
Rating
Not Available
Not Available

4 out of 5 | 5 Reviews
Find Old Friends From Grace M. Davis High School
Use the form below to search for alumni from Grace M. Davis High School.
School Description
School Summary and Highlights
- Enrolls 2,646 high school students from grades 9-12
- Ranks 420th out of 1,197 high schools in CA.
- 2010 Overall School AYP Met Status: No
Additional Contact Information
- Mailing Address: 1200 West Rumble Rd., Modesto, CA 95350
School Operational Details
- Title I Eligible
Faculty Details and Student Enrollment
Students and Faculty
- Total Students Enrolled: 2,646
- Total Full Time "Equivalent" Teachers: 94.0
- Average Student-To-Teacher Ratio: 28.2
Students Gender Breakdown
- Males: 1,394 (52.7%)
- Females: 1,252 (47.3%)
Free Lunch Student Eligibility Breakdown
- Eligible for Reduced Lunch: 201 (7.6%)
- Eligible for Free Lunch: 930 (35.1%)
- Eligible for Either Reduced or Free Lunch: 1,131 (42.7%)
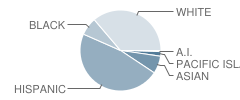
Student Enrollment Distribution by Race / Ethnicity
| Number | Percent | |
|---|---|---|
| American Indian | 16 | 0.6% |
| Black | 189 | 7.1% |
| Asian | 186 | 7.0% |
| Hispanic | 1,220 | 46.1% |
| White | 936 | 35.4% |
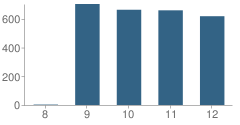
Number of Students Per Grade
| Number | Percent | |
|---|---|---|
| 8th Grade | 3 | 0.1% |
| 9th Grade | 703 | 26.6% |
| 10th Grade | 663 | 25.1% |
| 11th Grade | 659 | 24.9% |
| 12th Grade | 618 | 23.4% |
Graduates Information (2010)
Graduation Rate
School:
76.0%
District:
72.7%
State:
78.6%
Teacher Education Background (2009)
Percent With Master's Degree
School:
11.3%
District:
17.1%
Percent With Bachelor's Degree
School:
11.3%
District:
3.8%
Teacher Credentials & Experience (2009)
Percent of Teachers With Emergency Credentials: 12.3%
Percent of Teachers With Credentials: 99.1%
Number of Certificated Staff: 115.0
Average Number of Years of Teacher Experience: 14.6
Average Age
School:
43.5
District:
49.0
Source: CA Department of Education, Source: NCES 2009-2010
School Ratings and Reviews
Overall Rating: 4

4 out of 5 | 5 Reviews
The Overall Rating is the school's average rating from parents, students, school faculty and staff. The highest rating is five apples and the lowest is one apple.
Share Your Review About This School
5 reviews for Grace M. Davis High School
- Reviewed by Student on March 11, 2010
- Rating:
 (5 / 5) Flag as inappropriate
 - this school is the best.sure it may not seem like it but believe me as a current student [class of 2012 baby] haha u really know what the teachers are talking about if you really pay attention.and also,they are always there to listen when ever you need it.sure our school might have gangs there but thats not all there are skaters,goths,and well thats about it.so it doesnt really matter because most of the time we all get along. and we all show spartan spirit.we all just love it there and we can call it a place of our own. we are glad to be spartans sure it may not seem like it all the time but we really do because we all know it is our school and we all come together when its time to crush the other schools. haha. but yeah anyways back to the topic this school has got to be the BEST in stanislaus county.and if the school board gave us some more money like the other schools we might actually have the stuff to use on school projects but even if they dont we always make it work.we all love that school no matter what so everyone who says that,thats school is terrible well guess what... your wrong that school is GREAT ok.and if you all believed in us mabey we would raise our test scores. but you dont and thats what makes us not do anything.but yeah anyways GO SPARTANS!!!!!!!!!!!! lol.
- Reviewed by Parent/Guardian on February 19, 2010
- Rating: (5 / 5) Flag as inappropriate
- go davissssssssssssssssssssssssssssssssssssssssssssssssssssssssssssssssss spartan pride all the way people!!!!!!!
- Reviewed by Former Student on October 26, 2009
- Rating: (5 / 5) Flag as inappropriate
- this is a great school. i graduated last year in the top 50 in my class. i loved my school GO DAVIS
- Reviewed by Student on June 28, 2009
- Rating:
 (4 / 5) Flag as inappropriate
 - This school is Awesme!!:)
- Reviewed by Parent/Guardian on August 11, 2007
- Rating:
 (1 / 5) Flag as inappropriate
 - this school is the worst school ever built. all it is is a place of gangs and that's it. no educational value at all. do not send your kids here
School Map and Similar Schools Nearby
Click to Activate Map of Nearby School Campuses
Private
Public
This School
Similar Schools Nearby
| Roosevelt Junior High School 7-8 | 717 Students | 1.2 miles away |  5 out of 5 | |
| Fred C. Beyer High School 9-12 | 2,245 Students | 2.5 miles away |  4 out of 5 | |
| Thomas Downey High School 9-12 | 2,040 Students | 2.8 miles away | 5 out of 5 | |
| Modesto High School 9-12 | 2,933 Students | 3.4 miles away |  4.5 out of 5 | |
| Mark Twain Junior High School 7-8 | 650 Students | 3.4 miles away | Not Yet Rated | |
| La Loma Junior High School 7-8 | 532 Students | 3.4 miles away | Not Yet Rated | |
| James C. Enochs High School 9-12 | 2,586 Students | 4.1 miles away | Not Yet Rated | |
| Peter Johansen High School 9-12 | 2,268 Students | 5.5 miles away | 5 out of 5 | |
| Riverbank High School 9-12 | 744 Students | 6.1 miles away | Not Yet Rated | |
| Mae Hensley Junior High School 7-8 | 982 Students | 6.3 miles away | 5 out of 5 | |
Compare This School To Nearby Schools ->
School Community Forum

Join a discussion about Grace M. Davis High School and talk to others in the community including students, parents, teachers, and administrators.
Popular Discussion Topics
- Admissions and Registration Questions (e.g. Dress Code and Discipline Policy)
- School Calendar and Upcoming Events (e.g. Graduation)
- After School Programs, Extracurricular Activities, and Athletics (e.g. Football)
- News and Announcements (e.g. Yearbook and Class Supply List Details)
- Graduate and Alumni Events (e.g. Organizing Class Reunions)
Navigation
Can't Find What You Are Looking For?
Rankings
Nearby Cities
Sponsored Links
K-12 Articles

Keep Your Licensed Teen Safe This Summer
Every year hundreds of teenage drivers lose their lives in motor vehicle accidents. Statistics show...
Every year hundreds of teenage drivers lose their lives in motor vehicle accidents. Statistics show...

Choosing a Summer Camp for Your Child
Are you planning to send your child to summer camp this year? If so, have you taken his needs into...
Are you planning to send your child to summer camp this year? If so, have you taken his needs into...

Tips for Easing Your Child's Back to School Stress
Do you remember the roller coaster of emotions that you experienced as a child when the day for...
Do you remember the roller coaster of emotions that you experienced as a child when the day for...