Harmony Science Academy -Dallas

No Reviews Yet
Find Old Friends From Harmony Science Academy -Dallas
Use the form below to search for alumni from Harmony Science Academy -Dallas.
School Description
School Summary and Highlights
- Enrolls 776 elementary, middle, and high school students from grades KG-12
- Ranks 96th out of 1,325 high schools in TX.
- 2010 Overall School AYP Met Status: Yes
Additional Contact Information
- Principal or Admin: Nihat Guvercin
- Fax: (972) 234-9994
- Website: www.hsadallas.org
School Operational Details
- Title I EligibleAll students of this school are eligible for participation in authorized programs.
- Charter School
School District Details
- Harmony Science Academy
- Per-Pupil Spending: $8,166
- Graduation Rate: 57.4%
- Students Per Teacher: 15.8
- Enrolled Students: 1,804
Faculty Details and Student Enrollment
Students and Faculty
- Total Students Enrolled: 776
- Total Full Time "Equivalent" Teachers: 51.9
- Average Student-To-Teacher Ratio: 15.0
Students Gender Breakdown
- Males: 372 (47.9%)
- Females: 404 (52.1%)
Free Lunch Student Eligibility Breakdown
- Eligible for Reduced Lunch: 90 (11.6%)
- Eligible for Free Lunch: 530 (68.3%)
- Eligible for Either Reduced or Free Lunch: 620 (79.9%)
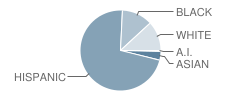
Student Enrollment Distribution by Race / Ethnicity

| Number | Percent | |
|---|---|---|
| American Indian | 3 | 0.4% |
| Black | 96 | 12.4% |
| Asian | 27 | 3.5% |
| Hispanic | 558 | 71.9% |
| White | 92 | 11.9% |
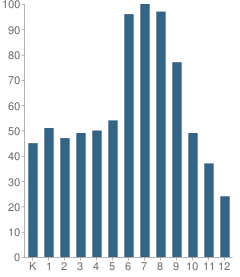
Number of Students Per Grade

| Number | Percent | |
|---|---|---|
| Kindergarten | 45 | 5.8% |
| 1st Grade | 51 | 6.6% |
| 2nd Grade | 47 | 6.1% |
| 3rd Grade | 49 | 6.3% |
| 4th Grade | 50 | 6.4% |
| 5th Grade | 54 | 7.0% |
| 6th Grade | 96 | 12.4% |
| 7th Grade | 100 | 12.9% |
| 8th Grade | 97 | 12.5% |
| 9th Grade | 77 | 9.9% |
| 10th Grade | 49 | 6.3% |
| 11th Grade | 37 | 4.8% |
| 12th Grade | 24 | 3.1% |
Breakdown of College Ready Graduates (2009)
Percent Ready For College in Reading
School:
71.0%
District:
54.0%
State:
62.0%
Percent Ready For College in Math
School:
64.0%
State:
60.0%
Faculty Breakdown (2010)
Average Teacher Experience
School:
2.2
District:
1.9
State:
11.3
Percent of Teachers With 1-5 Years Experience
School:
63.9%
District:
67.5%
State:
31.0%
Percent of Teachers With 6-10 Years Experience
School:
9.8%
District:
6.2%
State:
20.3%
Faculty Salary (2010)
School Administration Average Base Salary
School:
$68,830
District:
$68,359
State:
$70,209
Teacher Average Base Salary
School:
$38,520
District:
$38,970
State:
$48,263
Beginning Teacher Average Base Salary
School:
$36,097
District:
$37,052
State:
$41,165
Teacher With 1-5 Years Experience Average Base Salary
School:
$39,262
State:
$43,527
Teacher With 6-10 Years Experience Average Base Salary
School:
$40,208
State:
$46,149
Source: TX Department of Education, Source: NCES 2009-2010
School Ratings and Reviews
Be The First To Review Harmony Science Academy -Dallas!
Sponsored Links
Test Scores and Performance Information
Overall School Rating
How is this determined?
The overall school rating shows that Harmony Science Academy -Dallas performed on average better than many other schools across the state on TAKS state exams in the following subjects:
- English Language Arts
- Math
- Reading
- Science
- Social Studies
- Writing
AYP and Performance (2010)
Overall AYP Met: Yes
SAT & ACT Exam Details (2009)
Percent of Students Taking SAT or ACT Exam
School:
85.7%
District:
77.6%
State:
61.5%
Percent of Test Takers Above Exam Criteria
School:
16.7%
District:
13.2%
State:
26.9%
SAT Average Score
School:
915.0
District:
909.0
State:
985.0
TAKS - Test Proficiency by Grade and Subject
Grade 3 - % of students at or above proficiency
| School | District | State | |
|---|---|---|---|
| Math Test | |||
| 2010 | 95.0% | 96.0% | 86.0% |
| 2009 | 76.0% | 83.0% | 84.0% |
| 2008 | 93.0% | 87.0% | 83.0% |
| Reading Test | |||
| 2010 | 91.0% | 95.0% | 92.0% |
| 2009 | 78.0% | 87.0% | 89.0% |
| 2008 | 95.0% | 97.0% | 88.0% |
Grade 4 - % of students at or above proficiency
| School | District | State | |
|---|---|---|---|
| Math Test | |||
| 2010 | 98.0% | 97.0% | 88.0% |
| 2009 | 76.0% | 78.0% | 86.0% |
| 2008 | 83.0% | 86.0% | 84.0% |
| Reading Test | |||
| 2010 | 86.0% | 88.0% | 86.0% |
| 2009 | 89.0% | 87.0% | 84.0% |
| 2008 | 71.0% | 80.0% | 83.0% |
| Writing Test | |||
| 2010 | 86.0% | 94.0% | 92.0% |
| 2009 | 93.0% | 95.0% | 91.0% |
| 2008 | 100.0% | 94.0% | 91.0% |
Grade 5 - % of students at or above proficiency
| School | District | State | |
|---|---|---|---|
| Math Test | |||
| 2010 | 80.0% | 87.0% | 86.0% |
| 2009 | 93.0% | 93.0% | 84.0% |
| 2008 | 96.0% | 96.0% | 83.0% |
| Reading Test | |||
| 2010 | 86.0% | 90.0% | 85.0% |
| 2009 | 85.0% | 93.0% | 83.0% |
| 2008 | 89.0% | 93.0% | 83.0% |
| Science Test | |||
| 2010 | 86.0% | 91.0% | 88.0% |
| 2009 | 91.0% | 93.0% | 84.0% |
| 2008 | 85.0% | 87.0% | 81.0% |
Grade 6 - % of students at or above proficiency
| School | District | State | |
|---|---|---|---|
| Math Test | |||
| 2010 | 96.0% | 89.0% | 82.0% |
| 2009 | 93.0% | 91.0% | 80.0% |
| 2008 | 93.0% | 92.0% | 80.0% |
| Reading Test | |||
| 2010 | 90.0% | 93.0% | 86.0% |
| 2009 | 95.0% | 95.0% | 91.0% |
| 2008 | 92.0% | 95.0% | 91.0% |
Grade 7 - % of students at or above proficiency
| School | District | State | |
|---|---|---|---|
| Math Test | |||
| 2010 | 95.0% | 93.0% | 81.0% |
| 2009 | 86.0% | 89.0% | 79.0% |
| 2008 | 90.0% | 91.0% | 76.0% |
| Reading Test | |||
| 2010 | 98.0% | 96.0% | 86.0% |
| 2009 | 89.0% | 93.0% | 84.0% |
| 2008 | 96.0% | 96.0% | 84.0% |
| Writing Test | |||
| 2010 | 100.0% | 99.0% | 74.0% |
| 2009 | 99.0% | 99.0% | 72.0% |
| 2008 | 98.0% | 95.0% | 70.0% |
Grade 8 - % of students at or above proficiency
| School | District | State | |
|---|---|---|---|
| Math Test | |||
| 2010 | 91.0% | 94.0% | 80.0% |
| 2009 | 97.0% | 91.0% | 79.0% |
| 2008 | 99.0% | 98.0% | 75.0% |
| Reading Test | |||
| 2010 | 97.0% | 98.0% | 91.0% |
| 2009 | 99.0% | 99.0% | 93.0% |
| 2008 | 100.0% | 100.0% | 92.0% |
| Science Test | |||
| 2010 | 88.0% | 90.0% | 78.0% |
| 2009 | 87.0% | 88.0% | 72.0% |
| 2008 | 90.0% | 88.0% | 68.0% |
| Social Studies Test | |||
| 2010 | 100.0% | 100.0% | 95.0% |
| 2009 | 99.0% | 99.0% | 92.0% |
| 2008 | 100.0% | 100.0% | 90.0% |
Grade 9 - % of students at or above proficiency
| School | District | State | |
|---|---|---|---|
| Math Test | |||
| 2010 | 93.0% | 93.0% | 70.0% |
| 2009 | 97.0% | 91.0% | 67.0% |
| 2008 | 92.0% | 95.0% | 60.0% |
| Reading Test | |||
| 2010 | 97.0% | 95.0% | 92.0% |
| 2009 | 98.0% | 99.0% | 87.0% |
| 2008 | 98.0% | 99.0% | 84.0% |
| Science Test | |||
| 2008 | 67.0% | - | - |
| Social Studies Test | |||
| 2008 | 13.0% | - | - |
Grade 10 - % of students at or above proficiency
| School | District | State | |
|---|---|---|---|
| English Language Arts Test | |||
| 2010 | 100.0% | 99.0% | 90.0% |
| 2009 | 90.0% | 94.0% | 88.0% |
| 2008 | 93.0% | 93.0% | 86.0% |
| Math Test | |||
| 2010 | 96.0% | 90.0% | 74.0% |
| 2009 | 97.0% | 99.0% | 65.0% |
| 2008 | 82.0% | 90.0% | 63.0% |
| Science Test | |||
| 2010 | 96.0% | 91.0% | 74.0% |
| 2009 | 87.0% | 91.0% | 66.0% |
| 2008 | 74.0% | 78.0% | 64.0% |
| Social Studies Test | |||
| 2010 | 100.0% | 100.0% | 93.0% |
| 2009 | 95.0% | 97.0% | 90.0% |
| 2008 | 95.0% | 97.0% | 88.0% |
Grade 11 - % of students at or above proficiency
| School | District | State | |
|---|---|---|---|
| English Language Arts Test | |||
| 2010 | 97.0% | 97.0% | 93.0% |
| 2009 | 100.0% | 98.0% | 92.0% |
| 2008 | 93.0% | 91.0% | 90.0% |
| Math Test | |||
| 2010 | 97.0% | 94.0% | 89.0% |
| 2009 | 95.0% | 94.0% | 81.0% |
| 2008 | 100.0% | 94.0% | 79.0% |
| Science Test | |||
| 2010 | 94.0% | 95.0% | 91.0% |
| 2009 | 100.0% | 98.0% | 85.0% |
| 2008 | 93.0% | 89.0% | 80.0% |
| Social Studies Test | |||
| 2010 | 100.0% | 100.0% | 98.0% |
| 2009 | 100.0% | 98.0% | 97.0% |
| 2008 | 100.0% | 98.0% | 95.0% |
Source: TX Department of Education 2009-2010
School Map and Similar Schools Nearby
Click to Activate Map of Nearby School Campuses
Private
Public
This School
Similar Schools Nearby
| Richland Collegiate High School of Math Science 11-12 | 380 Students | 2.0 miles away | Not Yet Rated | |
| Early College High School 9-12 | 213 Students | 8.7 miles away | Not Yet Rated | |
Compare This School To Nearby Schools ->
School Community Forum

Join a discussion about Harmony Science Academy -Dallas and talk to others in the community including students, parents, teachers, and administrators.
Popular Discussion Topics
- Admissions and Registration Questions (e.g. Dress Code and Discipline Policy)
- School Calendar and Upcoming Events (e.g. Graduation)
- After School Programs, Extracurricular Activities, and Athletics (e.g. Football)
- News and Announcements (e.g. Yearbook and Class Supply List Details)
- Graduate and Alumni Events (e.g. Organizing Class Reunions)
Navigation
Can't Find What You Are Looking For?
Nearby Cities
Sponsored Links
K-12 Articles
Simple Math ... a Simple Gift
Math affects every aspect of our lives-from balancing the checkbook to estimating the amount of...
Asperger Syndrome: A Developmental Disorder on the Autism Spectrum
Asperger Syndrome, also known as Pervasive Developmental Disorder is on the high functioning end of...
Parent and Family Involvement in School
When visiting my grandson's school, I often hear administrators and teachers complaining that not...
