Brighton Elementary School
Rating
Not Available
Not Available

3 out of 5 | 2 Reviews
Find Old Friends From Brighton Elementary School
Use the form below to search for alumni from Brighton Elementary School.
School Description
School Summary and Highlights
- Enrolls 636 preschool and elementary school students from grades PK-6
- Ranks 1076th out of 1,149 elementary schools in VA.
Additional Contact Information
- Mailing Address: 1100 Portsmouth Blvd., Portsmouth, VA 23704
School Operational Details
- Title I EligibleAll students of this school are eligible for participation in authorized programs.
School District Details
- Portsmouth City Public Schools District
- Per-Pupil Spending: $9,928
- Graduation Rate: 57.9%
- Dropout Rate: 7.5%
- Students Per Teacher: 19.6
- Enrolled Students: 15,289
Faculty Details and Student Enrollment
Students and Faculty
- Total Students Enrolled: 636
- Total Full Time "Equivalent" Teachers: 33.0
- Average Student-To-Teacher Ratio: 19.3
Students Gender Breakdown
- Males: 303 (47.6%)
- Females: 332 (52.2%)
Free Lunch Student Eligibility Breakdown
- Eligible for Reduced Lunch: 16 (2.5%)
- Eligible for Free Lunch: 500 (78.6%)
- Eligible for Either Reduced or Free Lunch: 516 (81.1%)
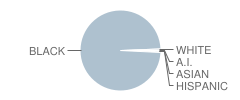
Student Enrollment Distribution by Race / Ethnicity
| Number | Percent | |
|---|---|---|
| American Indian | 1 | 0.2% |
| Black | 626 | 98.4% |
| Asian | 1 | 0.2% |
| Hispanic | 3 | 0.5% |
| White | 4 | 0.6% |
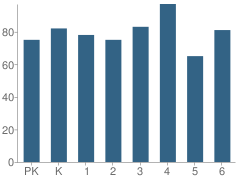
Number of Students Per Grade
| Number | Percent | |
|---|---|---|
| Pre-Kindergarten | 75 | 11.8% |
| Kindergarten | 82 | 12.9% |
| 1st Grade | 78 | 12.3% |
| 2nd Grade | 75 | 11.8% |
| 3rd Grade | 83 | 13.1% |
| 4th Grade | 97 | 15.3% |
| 5th Grade | 65 | 10.2% |
| 6th Grade | 81 | 12.7% |
Source: VA Department of Education, Source: NCES 2009-2010
School Ratings and Reviews
Overall Rating: 3

3 out of 5 | 2 Reviews
The Overall Rating is the school's average rating from parents, students, school faculty and staff. The highest rating is five apples and the lowest is one apple.
Share Your Review About This School
2 reviews for Brighton Elementary School
- Reviewed by Student on September 05, 2011
- Rating:
 (5 / 5) Flag as inappropriate
 - i'm a student at brigton elemetry and i think brighton rocks
- Reviewed by Former Student on July 26, 2009
- Rating:
 (1 / 5) Flag as inappropriate
 - Not the best school. Actually, the worst in Portsmouth. The classes are full of misbeahved children. Be prepared for your child to spend most of their day listening to the teacher keeping the class in line, while not learning much at all. Your child might come home with a new knowledge of foul language on any given day. Perhaps even being attacked and jumped by several other kids. This school is comprised of the lowest socioeconomic area in Portsmouth- these kids would all be better off if they were rezoned into schools that would allow more oppertunity via diversity/ funding/smaller classes. If you care about your child and happen to be zoned for this school, rethink your options. The teachers here would not even send their own child to this school.
School Map and Similar Schools Nearby
Click to Activate Map of Nearby School Campuses
Private
Public
This School
Similar Schools Nearby
| Park View Elementary School PK-6 | 670 Students | 1.5 miles away | Not Yet Rated | |
| James Hurst Elementary School PK-6 | 693 Students | 1.5 miles away | Not Yet Rated | |
| St. Helena Elementary School PK-5 | 331 Students | 1.7 miles away | Not Yet Rated | |
| Rena B. Wright Primary School PK-2 | 315 Students | 1.8 miles away | Not Yet Rated | - |
| Truitt Intermediate School 3-5 | 300 Students | 2.1 miles away |  3 out of 5 | |
| Westhaven Elementary School PK-6 | 608 Students | 2.2 miles away | Not Yet Rated | |
| John Tyler Elementary School PK-6 | 840 Students | 2.6 miles away |  4 out of 5 | |
| Campostella Elementary School PK-5 | 703 Students | 2.8 miles away | 4 out of 5 | |
| Tidewater Park Elementary School PK-5 | 369 Students | 2.9 miles away | Not Yet Rated | |
| Young Park Elementary School PK-5 | 410 Students | 2.9 miles away |  5 out of 5 | |
Compare This School To Nearby Schools ->
School Community Forum

Join a discussion about Brighton Elementary School and talk to others in the community including students, parents, teachers, and administrators.
Popular Discussion Topics
- Admissions and Registration Questions (e.g. Dress Code and Discipline Policy)
- School Calendar and Upcoming Events (e.g. Graduation)
- After School Programs, Extracurricular Activities, and Athletics (e.g. Football)
- News and Announcements (e.g. Yearbook and Class Supply List Details)
- Graduate and Alumni Events (e.g. Organizing Class Reunions)
Navigation
Can't Find What You Are Looking For?
Rankings
Nearby Cities
Sponsored Links
K-12 Articles

Choosing a Summer Camp for Your Child
Are you planning to send your child to summer camp this year? If so, have you taken his needs into...
Are you planning to send your child to summer camp this year? If so, have you taken his needs into...

Teaching Children Respect
Statistics prove that there are many different family types in today's society. Grandparents or a...
Statistics prove that there are many different family types in today's society. Grandparents or a...

Siblings and Individual Identity in High School
When the first day of high school looms in the near future, teens are both excited and anxious....
When the first day of high school looms in the near future, teens are both excited and anxious....