Fame Public Charter School

5 out of 5 | 1 Review
Find Old Friends From Fame Public Charter School
Use the form below to search for alumni from Fame Public Charter School.
School Description
School Summary and Highlights
- Enrolls 1,439 elementary, middle, and high school students from grades KG-12
- Ranks 833rd out of 1,197 high schools in CA.
- 2010 Overall School AYP Met Status: No
Additional Contact Information
- Mailing Address: 39899 Balentine Dr., Ste. 335, Newark, CA 94560
School Operational Details
- Charter School
School District Details
- Alameda County Office of Education
- Per-Pupil Spending: $21,217
- Graduation Rate: 86.0%
- Dropout Rate: 68.0%
- Students Per Teacher: 19.2
- Enrolled Students: 2,225
Faculty Details and Student Enrollment
Students and Faculty
- Total Students Enrolled: 1,439
- Total Full Time "Equivalent" Teachers: 59.3
- Average Student-To-Teacher Ratio: 24.3
Students Gender Breakdown
- Males: 682 (47.4%)
- Females: 757 (52.6%)
Free Lunch Student Eligibility Breakdown
- Eligible for Reduced Lunch: 102 (7.1%)
- Eligible for Free Lunch: 423 (29.4%)
- Eligible for Either Reduced or Free Lunch: 525 (36.5%)
Student Enrollment Distribution by Race / Ethnicity
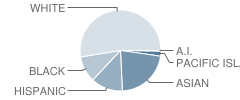
| Number | Percent | |
|---|---|---|
| American Indian | 6 | 0.4% |
| Black | 146 | 10.1% |
| Asian | 307 | 21.3% |
| Hispanic | 179 | 12.4% |
| White | 731 | 50.8% |
Number of Students Per Grade
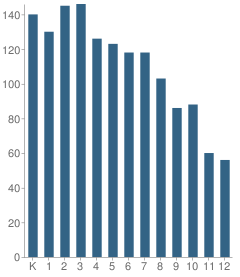
| Number | Percent | |
|---|---|---|
| Kindergarten | 140 | 9.7% |
| 1st Grade | 130 | 9.0% |
| 2nd Grade | 145 | 10.1% |
| 3rd Grade | 146 | 10.1% |
| 4th Grade | 126 | 8.8% |
| 5th Grade | 123 | 8.5% |
| 6th Grade | 118 | 8.2% |
| 7th Grade | 118 | 8.2% |
| 8th Grade | 103 | 7.2% |
| 9th Grade | 86 | 6.0% |
| 10th Grade | 88 | 6.1% |
| 11th Grade | 60 | 4.2% |
| 12th Grade | 56 | 3.9% |
Graduates Information (2010)
Graduation Rate
School:
76.1%
District:
79.1%
State:
78.6%
Teacher Education Background (2009)
Percent With Master's Degree
School:
17.6%
District:
50.0%
Percent With Bachelor's Degree
School:
14.9%
District:
6.3%
Teacher Credentials & Experience (2009)
Percent of Teachers With Emergency Credentials: 1.5%
Percent of Teachers With Credentials: 92.5%
Number of Certificated Staff: 74.0
Average Number of Years of Teacher Experience: 9.5
Average Age
School:
41.6
District:
48.2
Source: CA Department of Education, Source: NCES 2009-2010
Sponsored Links
Test Scores and Performance Information
Overall School Rating
How is this determined?
The overall school rating shows that Fame Public Charter School performed on average about the same as other schools across the state on CST state exams in the following subjects:
- CST Algebra I
- CST Algebra II
- CST Biology
- CST Chemistry
- CST Earth Science
- CST English-Language Arts
- CST General Mathematics
- CST Geometry
- CST History - Social Science
- CST Integrated/Coordinated Science
- CST Mathematics
- CST Science
- CST U.S. History
- CST World History
AYP Results (2010)
Overall AYP Met: No
ELA AYP Met: No
Math AYP Met: No
ACT Exam Results (2009)
Percent of Students Taking ACT Exam: 3.2%
SAT Exam Results (2009)
Percent of Students Taking SAT Exam: 14.3%
CST - Test Proficiency by Grade and Subject
Grade 2 - % of students at or above proficiency
| School | District | State | |
|---|---|---|---|
| CST English-Language Arts Test | |||
| 2010 | 56.0% | - | 53.0% |
| 2009 | 47.0% | - | 53.0% |
| 2008 | 34.0% | - | 48.0% |
| CST Mathematics Test | |||
| 2010 | 63.0% | - | 62.0% |
| 2009 | 47.0% | - | 63.0% |
| 2008 | 32.0% | - | 59.0% |
Grade 3 - % of students at or above proficiency
| School | District | State | |
|---|---|---|---|
| CST English-Language Arts Test | |||
| 2010 | 39.0% | - | 43.0% |
| 2009 | 43.0% | - | 44.0% |
| 2008 | 31.0% | - | 38.0% |
| CST Mathematics Test | |||
| 2010 | 49.0% | - | 65.0% |
| 2009 | 45.0% | - | 64.0% |
| 2008 | 40.0% | - | 61.0% |
Grade 4 - % of students at or above proficiency
| School | District | State | |
|---|---|---|---|
| CST English-Language Arts Test | |||
| 2010 | 66.0% | - | 63.0% |
| 2009 | 73.0% | - | 61.0% |
| 2008 | 49.0% | - | 55.0% |
| CST Mathematics Test | |||
| 2010 | 52.0% | - | 68.0% |
| 2009 | 61.0% | - | 66.0% |
| 2008 | 46.0% | - | 61.0% |
Grade 5 - % of students at or above proficiency
| School | District | State | |
|---|---|---|---|
| CST English-Language Arts Test | |||
| 2010 | 62.0% | - | 58.0% |
| 2009 | 53.0% | - | 54.0% |
| 2008 | 58.0% | - | 48.0% |
| CST Mathematics Test | |||
| 2010 | 45.0% | - | 61.0% |
| 2009 | 35.0% | - | 57.0% |
| 2008 | 42.0% | - | 51.0% |
| CST Science Test | |||
| 2010 | 54.0% | - | 56.0% |
| 2009 | 40.0% | - | 49.0% |
| 2008 | 53.0% | - | 46.0% |
Grade 6 - % of students at or above proficiency
| School | District | State | |
|---|---|---|---|
| CST English-Language Arts Test | |||
| 2010 | 46.0% | - | 55.0% |
| 2009 | 55.0% | - | 52.0% |
| 2008 | 46.0% | - | 47.0% |
| CST Mathematics Test | |||
| 2010 | 32.0% | - | 52.0% |
| 2009 | 41.0% | - | 49.0% |
| 2008 | 39.0% | - | 44.0% |
Grade 7 - % of students at or above proficiency
| School | District | State | |
|---|---|---|---|
| CST English-Language Arts Test | |||
| 2010 | 57.0% | - | 55.0% |
| 2009 | 53.0% | 9.0% | 54.0% |
| 2008 | 62.0% | 17.0% | 49.0% |
| CST Mathematics Test | |||
| 2010 | 47.0% | - | 48.0% |
| 2009 | 33.0% | - | 43.0% |
| 2008 | 37.0% | - | 41.0% |
Grade 8 - % of students at or above proficiency
| School | District | State | |
|---|---|---|---|
| CST Algebra I Test | |||
| 2010 | 51.0% | - | 46.0% |
| 2009 | 54.0% | - | 44.0% |
| 2008 | 49.0% | - | 42.0% |
| CST English-Language Arts Test | |||
| 2010 | 51.0% | - | 54.0% |
| 2009 | 55.0% | 6.0% | 48.0% |
| 2008 | 55.0% | - | 45.0% |
| CST General Mathematics Test | |||
| 2010 | 34.0% | - | 30.0% |
| 2009 | 44.0% | 4.0% | 30.0% |
| 2008 | 37.0% | - | 31.0% |
| CST History - Social Science Test | |||
| 2010 | 38.0% | - | 47.0% |
| 2009 | 38.0% | 3.0% | 42.0% |
| 2008 | 36.0% | - | 36.0% |
| CST Science Test | |||
| 2010 | 52.0% | - | 59.0% |
| 2009 | 55.0% | 4.0% | 56.0% |
| 2008 | 43.0% | - | 52.0% |
Grade 9 - % of students at or above proficiency
| School | District | State | |
|---|---|---|---|
| CST Algebra I Test | |||
| 2010 | 3.0% | 7.0% | 22.0% |
| 2009 | 15.0% | - | 21.0% |
| 2008 | 14.0% | - | 18.0% |
| CST Earth Science Test | |||
| 2010 | 27.0% | - | 35.0% |
| 2009 | 20.0% | - | 29.0% |
| 2008 | 33.0% | - | 31.0% |
| CST English-Language Arts Test | |||
| 2010 | 45.0% | 11.0% | 54.0% |
| 2009 | 49.0% | 7.0% | 50.0% |
| 2008 | 41.0% | 9.0% | 49.0% |
| CST General Mathematics Test | |||
| 2010 | 8.0% | 5.0% | 17.0% |
| 2009 | 9.0% | 6.0% | 17.0% |
| 2008 | 4.0% | 9.0% | 18.0% |
| CST Geometry Test | |||
| 2010 | 14.0% | - | 46.0% |
| 2009 | 54.0% | - | 47.0% |
| 2008 | 24.0% | - | 43.0% |
| CST World History Test | |||
| 2010 | 50.0% | - | 45.0% |
| 2009 | 41.0% | 3.0% | 41.0% |
| 2008 | 12.0% | - | 36.0% |
| CST Biology Test | |||
| 2009 | 36.0% | - | 51.0% |
| 2008 | 28.0% | - | 52.0% |
Grade 10 - % of students at or above proficiency
| School | District | State | |
|---|---|---|---|
| CST Algebra I Test | |||
| 2010 | 8.0% | - | 12.0% |
| 2009 | 6.0% | 8.0% | 11.0% |
| 2008 | 6.0% | 13.0% | 9.0% |
| CST Algebra II Test | |||
| 2010 | 24.0% | - | 40.0% |
| 2009 | 9.0% | - | 37.0% |
| 2008 | 8.0% | - | 36.0% |
| CST Biology Test | |||
| 2010 | 35.0% | - | 38.0% |
| 2009 | 22.0% | - | 34.0% |
| 2008 | 19.0% | - | 35.0% |
| CST English-Language Arts Test | |||
| 2010 | 44.0% | 8.0% | 45.0% |
| 2009 | 34.0% | 9.0% | 44.0% |
| 2008 | 43.0% | 3.0% | 41.0% |
| CST Geometry Test | |||
| 2010 | 6.0% | - | 14.0% |
| 2009 | 7.0% | - | 14.0% |
| 2008 | 23.0% | - | 12.0% |
| CST Science Test | |||
| 2010 | 36.0% | 3.0% | 46.0% |
| 2009 | 28.0% | 2.0% | 44.0% |
| 2008 | 26.0% | 3.0% | 40.0% |
| CST World History Test | |||
| 2010 | 29.0% | - | 42.0% |
| 2009 | 13.0% | 3.0% | 38.0% |
| 2008 | 28.0% | - | 33.0% |
| CST Integrated/Coordinated Science Test | |||
| 2008 | 21.0% | - | 7.0% |
Grade 11 - % of students at or above proficiency
| School | District | State | |
|---|---|---|---|
| CST Algebra II Test | |||
| 2010 | 6.0% | - | 14.0% |
| 2009 | 8.0% | - | 12.0% |
| 2008 | 9.0% | - | 11.0% |
| CST Chemistry Test | |||
| 2010 | 8.0% | - | 30.0% |
| 2009 | 15.0% | - | 27.0% |
| 2008 | 14.0% | - | 25.0% |
| CST English-Language Arts Test | |||
| 2010 | 37.0% | - | 42.0% |
| 2009 | 37.0% | 4.0% | 40.0% |
| 2008 | 24.0% | 3.0% | 37.0% |
| CST U.S. History Test | |||
| 2010 | 24.0% | 1.0% | 45.0% |
| 2009 | 30.0% | 3.0% | 44.0% |
| 2008 | 17.0% | 1.0% | 38.0% |
| CST World History Test | |||
| 2009 | 22.0% | - | 11.0% |
End of Course - % of students at or above proficiency
| School | District | State | |
|---|---|---|---|
| CST Algebra I Test | |||
| 2010 | 28.0% | 4.0% | 31.0% |
| 2009 | 25.0% | 4.0% | 28.0% |
| 2008 | 28.0% | 10.0% | 25.0% |
| CST Algebra II Test | |||
| 2010 | 17.0% | - | 31.0% |
| 2009 | 16.0% | - | 28.0% |
| 2008 | 16.0% | - | 27.0% |
| CST Biology Test | |||
| 2010 | 35.0% | 15.0% | 46.0% |
| 2009 | 28.0% | 4.0% | 42.0% |
| 2008 | 21.0% | - | 42.0% |
| CST Chemistry Test | |||
| 2010 | 14.0% | - | 38.0% |
| 2009 | 29.0% | - | 36.0% |
| 2008 | 16.0% | - | 32.0% |
| CST Earth Science Test | |||
| 2010 | 26.0% | - | 33.0% |
| 2009 | 19.0% | - | 28.0% |
| 2008 | 29.0% | - | 28.0% |
| CST General Mathematics Test | |||
| 2010 | 25.0% | 3.0% | 27.0% |
| 2009 | 35.0% | 6.0% | 26.0% |
| 2008 | 25.0% | 6.0% | 27.0% |
| CST Geometry Test | |||
| 2010 | 11.0% | - | 27.0% |
| 2009 | 33.0% | - | 26.0% |
| 2008 | 23.0% | - | 24.0% |
| CST World History Test | |||
| 2010 | 33.0% | 2.0% | 41.0% |
| 2009 | 23.0% | 2.0% | 38.0% |
| 2008 | 20.0% | - | 33.0% |
| CST Integrated/Coordinated Science Test | |||
| 2009 | 21.0% | - | 13.0% |
| 2008 | 19.0% | - | 11.0% |
Source: CA Department of Education 2009-2010
School Map and Similar Schools Nearby
Click to Activate Map of Nearby School Campuses
Private
Public
This School
Similar Schools Nearby
| Circle of Independent Learning School KG-12 | 254 Students | 1.1 miles away | Not Yet Rated | |
| Aspire East Palo Alto Phoenix Academy 9-12 | 79 Students | 8.5 miles away | Not Yet Rated | - |
| Leadership Public Schools - Hayward 9-12 | 429 Students | 8.8 miles away | Not Yet Rated | - |
| Stanford New School KG-12 | 554 Students | 9.9 miles away | Not Yet Rated | |
Compare This School To Nearby Schools ->
School Community Forum

Join a discussion about Fame Public Charter School and talk to others in the community including students, parents, teachers, and administrators.
Popular Discussion Topics
- Admissions and Registration Questions (e.g. Dress Code and Discipline Policy)
- School Calendar and Upcoming Events (e.g. Graduation)
- After School Programs, Extracurricular Activities, and Athletics (e.g. Football)
- News and Announcements (e.g. Yearbook and Class Supply List Details)
- Graduate and Alumni Events (e.g. Organizing Class Reunions)
Navigation
Can't Find What You Are Looking For?
Rankings
Nearby Cities
Sponsored Links
K-12 Articles
A Cheat Sheet on Cheating
Senior projects are coming due and finals are coming up. Spring has sprung, and with spring comes...
Feeling Good in Your Own Skin
Body image is a very touchy issue with today's kids. Since the 1950s, when Barbie was first...
Teaching Kids to Deal with Peer Pressure
Parents usually become very concerned when they hear the term "peer pressure." However, peer...


(5 / 5)