William J. 'pete' Knight High School
Rating
Not Available
Not Available

5 out of 5 | 2 Reviews
Find Old Friends From William J. 'pete' Knight High School
Use the form below to search for alumni from William J. 'pete' Knight High School.
School Description
School Summary and Highlights
- Enrolls 3,450 high school students from grades 9-12
- Ranks 852nd out of 1,197 high schools in CA.
- 2010 Overall School AYP Met Status: No
Additional Contact Information
- Mailing Address: 37423 70th St. East, Palmdale, CA 93552
School Operational Details
- Title I EligibleAll students of this school are eligible for participation in authorized programs.
School District Details
- Antelope Valley Union High School District
- Per-Pupil Spending: $8,017
- Graduation Rate: 87.0%
- Dropout Rate: 6.5%
- Students Per Teacher: 23.6
- Enrolled Students: 26,211
Faculty Details and Student Enrollment
Students and Faculty
- Total Students Enrolled: 3,450
- Total Full Time "Equivalent" Teachers: 143.4
- Average Student-To-Teacher Ratio: 24.1
Students Gender Breakdown
- Males: 1,795 (52.0%)
- Females: 1,655 (48.0%)
Free Lunch Student Eligibility Breakdown
- Eligible for Reduced Lunch: 707 (20.5%)
- Eligible for Free Lunch: 1,791 (51.9%)
- Eligible for Either Reduced or Free Lunch: 2,498 (72.4%)
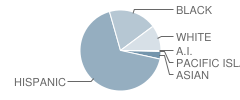
Student Enrollment Distribution by Race / Ethnicity
| Number | Percent | |
|---|---|---|
| American Indian | 11 | 0.3% |
| Black | 661 | 19.2% |
| Asian | 105 | 3.0% |
| Hispanic | 2,307 | 66.9% |
| White | 352 | 10.2% |
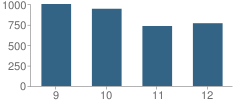
Number of Students Per Grade
| Number | Percent | |
|---|---|---|
| 9th Grade | 1,003 | 29.1% |
| 10th Grade | 945 | 27.4% |
| 11th Grade | 734 | 21.3% |
| 12th Grade | 768 | 22.3% |
Graduates Information (2010)
Graduation Rate
School:
91.2%
District:
80.2%
State:
78.6%
Teacher Education Background (2009)
Percent With Master's Degree
School:
20.4%
District:
47.1%
Percent With Bachelor's Degree
School:
16.2%
District:
11.8%
Percent With Ph.D.
School:
1.4%
District:
9.8%
Teacher Credentials & Experience (2009)
Average Age
School:
38.1
District:
45.9
Average Number of Years of Teacher Experience: 7.8
Number of Certificated Staff: 142.0
Percent of Teachers With Credentials: 85.0%
Percent of Teachers With Emergency Credentials: 3.9%
Source: CA Department of Education, Source: NCES 2009-2010
School Ratings and Reviews
Overall Rating: 5

5 out of 5 | 2 Reviews
The Overall Rating is the school's average rating from parents, students, school faculty and staff. The highest rating is five apples and the lowest is one apple.
Share Your Review About This School
2 reviews for William J. 'pete' Knight High School
- Reviewed by Parent/Guardian on June 16, 2010
- Rating:
 (5 / 5) Flag as inappropriate
 - I would like some information on your high school program. I also would like some information on sports and clubs. Thank you
- Reviewed by Former Student on December 18, 2008
- Rating: (5 / 5) Flag as inappropriate
- I think that the school is great. There is so much to do in the school and there isnt as much violence as there is in the other highschools. The teachers are great too. Many children get advice from the teachers and the school counselours. Also there are teachers that give you advice on what colleges to go to if you are planning on going to college.
School Map and Similar Schools Nearby
Click to Activate Map of Nearby School Campuses
Private
Public
This School
Similar Schools Nearby
| Littlerock High School 9-12 | 1,795 Students | 4.2 miles away |  5 out of 5 | |
| Palmdale High School 9-12 | 3,285 Students | 4.8 miles away |  3 out of 5 | |
| Eastside High School 9-12 | 2,527 Students | 9.2 miles away |  3.5 out of 5 | |
| Highland High School 9-12 | 2,960 Students | 9.6 miles away | 3 out of 5 | |
| Antelope Valley High School 9-12 | 1,772 Students | 11.8 miles away |  4.5 out of 5 | |
| Vasquez High School 9-12 | 609 Students | 12.9 miles away |  2.5 out of 5 | |
| Lancaster High School 9-12 | 2,751 Students | 13.8 miles away | 3 out of 5 | |
| Quartz Hill High School 9-12 | 3,118 Students | 14.9 miles away | Not Yet Rated | |
| Rosamond High School 9-12 | 921 Students | 23.2 miles away | 5 out of 5 | |
| Desert High School 7-12 | 622 Students | 25.2 miles away | Not Yet Rated | |
Compare This School To Nearby Schools ->
School Community Forum

Join a discussion about William J. 'pete' Knight High School and talk to others in the community including students, parents, teachers, and administrators.
Popular Discussion Topics
- Admissions and Registration Questions (e.g. Dress Code and Discipline Policy)
- School Calendar and Upcoming Events (e.g. Graduation)
- After School Programs, Extracurricular Activities, and Athletics (e.g. Football)
- News and Announcements (e.g. Yearbook and Class Supply List Details)
- Graduate and Alumni Events (e.g. Organizing Class Reunions)
Navigation
Can't Find What You Are Looking For?
Rankings
Nearby Cities
Sponsored Links
K-12 Articles

Breakfast, Kids and Learning
For generations parents have been telling their kids that breakfast is the most important meal of...
For generations parents have been telling their kids that breakfast is the most important meal of...

Teaching Children with Learning Disabilities to Make Friends
Children with learning disabilities often have trouble making and retaining friendships. Some kids...
Children with learning disabilities often have trouble making and retaining friendships. Some kids...

Cell Phones... the Best Thing Since Sliced Bread or the Worst Invention in the World?
Cell phones are wonderful, the best things humans have ever invented! They help us keep in touch...
Cell phones are wonderful, the best things humans have ever invented! They help us keep in touch...