Capistrano Connections Academy
- Grades: KG-12
- Student Enrollment: 1,020

No Reviews Yet
Use the form below to search for alumni from Capistrano Connections Academy.
School Description
Capistrano Connections Academy (CapoCA) provides a new form of public school that students can attend from home.
This unique program combines
· the expertise and accountability of publicly funded education,
· strong parental involvement,
· and the flexibility of online classes.
Tuition-free Public School for Grades K–12
Capistrano Connections Academy (CapoCA) is a charter school authorized by the Capistrano Unified School District. CapoCA serves students in grades K–12 who reside in San Diego, Orange, Riverside, Los Angeles, and San Bernardino counties.
Parents pay no tuition for students to attend CapoCA. Students are considered to be enrolled in a public school.
Materials Provided by the School
· certified teachers,
· textbooks and other curriculum materials,
· and online resources, such as movies and encyclopedias.
Capistrano Connections Academy is fully accredited for grades K-12 by the Commission for Schools of the Western Association of Schools and Colleges. Both Connections Academy, LLC, and Capistrano Connections Academy also hold accreditation from The Commission on International and Trans-Regional Accreditation (CITA).
Faculty Details and Student Enrollment
- Total Students Enrolled: 1,020
- Total Full Time "Equivalent" Teachers: 37.3
- Average Student-To-Teacher Ratio: 27.4
- Males: 528 (51.8%)
- Females: 492 (48.2%)
- Eligible for Reduced Lunch: 111 (10.9%)
- Eligible for Free Lunch: 257 (25.2%)
- Eligible for Either Reduced or Free Lunch: 368 (36.1%)

| Number | Percent | |
|---|---|---|
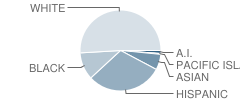
| American Indian | 12 | 1.2% |
| Black | 99 | 9.7% |
| Asian | 57 | 5.6% |
| Hispanic | 273 | 26.8% |
| White | 457 | 44.8% |

| Number | Percent | |
|---|---|---|
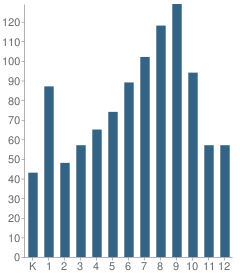
| Kindergarten | 43 | 4.2% |
| 1st Grade | 87 | 8.5% |
| 2nd Grade | 48 | 4.7% |
| 3rd Grade | 57 | 5.6% |
| 4th Grade | 65 | 6.4% |
| 5th Grade | 74 | 7.3% |
| 6th Grade | 89 | 8.7% |
| 7th Grade | 102 | 10.0% |
| 8th Grade | 118 | 11.6% |
| 9th Grade | 129 | 12.6% |
| 10th Grade | 94 | 9.2% |
| 11th Grade | 57 | 5.6% |
| 12th Grade | 57 | 5.6% |
School Ratings and Reviews
Be The First To Review Capistrano Connections Academy!
Sponsored Links
Test Scores and Performance Information
Overall School Rating
- CST Algebra I
- CST Algebra II
- CST Biology
- CST Chemistry
- CST Earth Science
- CST English-Language Arts
- CST General Mathematics
- CST Geometry
- CST History - Social Science
- CST Integrated/Coordinated Science
- CST Mathematics
- CST Science
- CST Summative High School Math
- CST U.S. History
- CST World History
CST - Test Proficiency by Grade and Subject
Grade 2 - % of students at or above proficiency
| School | District | State | |
|---|---|---|---|
| CST English-Language Arts Test | |||
| 2010 | 51.0% | 70.0% | 53.0% |
| 2009 | 19.0% | 73.0% | 53.0% |
| 2008 | 38.0% | 68.0% | 48.0% |
| CST Mathematics Test | |||
| 2010 | 53.0% | 73.0% | 62.0% |
| 2009 | 32.0% | 80.0% | 63.0% |
| 2008 | 36.0% | 75.0% | 59.0% |
Grade 3 - % of students at or above proficiency
| School | District | State | |
|---|---|---|---|
| CST English-Language Arts Test | |||
| 2010 | 39.0% | 63.0% | 43.0% |
| 2009 | 46.0% | 66.0% | 44.0% |
| 2008 | 41.0% | 57.0% | 38.0% |
| CST Mathematics Test | |||
| 2010 | 63.0% | 77.0% | 65.0% |
| 2009 | 62.0% | 77.0% | 64.0% |
| 2008 | 43.0% | 73.0% | 61.0% |
Grade 4 - % of students at or above proficiency
| School | District | State | |
|---|---|---|---|
| CST English-Language Arts Test | |||
| 2010 | 71.0% | 82.0% | 63.0% |
| 2009 | 73.0% | 80.0% | 61.0% |
| 2008 | 67.0% | 76.0% | 55.0% |
| CST Mathematics Test | |||
| 2010 | 58.0% | 78.0% | 68.0% |
| 2009 | 64.0% | 75.0% | 66.0% |
| 2008 | 44.0% | 71.0% | 61.0% |
Grade 5 - % of students at or above proficiency
| School | District | State | |
|---|---|---|---|
| CST English-Language Arts Test | |||
| 2010 | 62.0% | 74.0% | 58.0% |
| 2009 | 67.0% | 73.0% | 54.0% |
| 2008 | 58.0% | 64.0% | 48.0% |
| CST Mathematics Test | |||
| 2010 | 51.0% | 63.0% | 61.0% |
| 2009 | 46.0% | 63.0% | 57.0% |
| 2008 | 47.0% | 55.0% | 51.0% |
| CST Science Test | |||
| 2010 | 76.0% | 73.0% | 56.0% |
| 2009 | 67.0% | 67.0% | 49.0% |
| 2008 | 59.0% | 65.0% | 46.0% |
Grade 6 - % of students at or above proficiency
| School | District | State | |
|---|---|---|---|
| CST English-Language Arts Test | |||
| 2010 | 61.0% | 76.0% | 55.0% |
| 2009 | 62.0% | 72.0% | 52.0% |
| 2008 | 54.0% | 61.0% | 47.0% |
| CST Mathematics Test | |||
| 2010 | 41.0% | 68.0% | 52.0% |
| 2009 | 44.0% | 62.0% | 49.0% |
| 2008 | 50.0% | 54.0% | 44.0% |
Grade 7 - % of students at or above proficiency
| School | District | State | |
|---|---|---|---|
| CST English-Language Arts Test | |||
| 2010 | 76.0% | 78.0% | 55.0% |
| 2009 | 63.0% | 74.0% | 54.0% |
| 2008 | 54.0% | 68.0% | 49.0% |
| CST Mathematics Test | |||
| 2010 | 45.0% | 68.0% | 48.0% |
| 2009 | 34.0% | 59.0% | 43.0% |
| 2008 | 43.0% | 54.0% | 41.0% |
Grade 8 - % of students at or above proficiency
| School | District | State | |
|---|---|---|---|
| CST Algebra I Test | |||
| 2010 | 50.0% | 83.0% | 46.0% |
| 2009 | 40.0% | 90.0% | 44.0% |
| 2008 | 50.0% | 86.0% | 42.0% |
| CST English-Language Arts Test | |||
| 2010 | 68.0% | 75.0% | 54.0% |
| 2009 | 59.0% | 73.0% | 48.0% |
| 2008 | 58.0% | 65.0% | 45.0% |
| CST General Mathematics Test | |||
| 2010 | 42.0% | 56.0% | 30.0% |
| 2009 | 22.0% | 60.0% | 30.0% |
| 2008 | 24.0% | 56.0% | 31.0% |
| CST History - Social Science Test | |||
| 2010 | 51.0% | 71.0% | 47.0% |
| 2009 | 52.0% | 71.0% | 42.0% |
| 2008 | 45.0% | 61.0% | 36.0% |
| CST Science Test | |||
| 2010 | 60.0% | 83.0% | 59.0% |
| 2009 | 58.0% | 83.0% | 56.0% |
| 2008 | 49.0% | 76.0% | 52.0% |
Grade 9 - % of students at or above proficiency
| School | District | State | |
|---|---|---|---|
| CST Algebra I Test | |||
| 2010 | 9.0% | 59.0% | 22.0% |
| 2009 | 19.0% | 66.0% | 21.0% |
| 2008 | 6.0% | 49.0% | 18.0% |
| CST Biology Test | |||
| 2010 | 34.0% | 88.0% | 55.0% |
| 2009 | 51.0% | 88.0% | 51.0% |
| 2008 | 45.0% | 88.0% | 52.0% |
| CST Earth Science Test | |||
| 2010 | 52.0% | 44.0% | 35.0% |
| 2009 | 35.0% | 38.0% | 29.0% |
| CST English-Language Arts Test | |||
| 2010 | 63.0% | 77.0% | 54.0% |
| 2009 | 64.0% | 75.0% | 50.0% |
| 2008 | 67.0% | 72.0% | 49.0% |
| CST General Mathematics Test | |||
| 2010 | 23.0% | 32.0% | 17.0% |
| 2009 | 16.0% | 36.0% | 17.0% |
| 2008 | 28.0% | 40.0% | 18.0% |
| CST Geometry Test | |||
| 2010 | 28.0% | 75.0% | 46.0% |
| 2009 | 50.0% | 84.0% | 47.0% |
| 2008 | 47.0% | 77.0% | 43.0% |
| CST World History Test | |||
| 2010 | 23.0% | 93.0% | 45.0% |
| 2009 | 38.0% | 86.0% | 41.0% |
Grade 10 - % of students at or above proficiency
| School | District | State | |
|---|---|---|---|
| CST Algebra I Test | |||
| 2010 | 6.0% | 24.0% | 12.0% |
| 2009 | 9.0% | 24.0% | 11.0% |
| CST Algebra II Test | |||
| 2010 | 25.0% | 54.0% | 40.0% |
| 2009 | 28.0% | 52.0% | 37.0% |
| CST Biology Test | |||
| 2010 | 45.0% | 65.0% | 38.0% |
| 2009 | 29.0% | 68.0% | 34.0% |
| 2008 | 21.0% | 65.0% | 35.0% |
| CST Chemistry Test | |||
| 2010 | 40.0% | 71.0% | 47.0% |
| 2009 | 54.0% | 76.0% | 44.0% |
| CST English-Language Arts Test | |||
| 2010 | 65.0% | 64.0% | 45.0% |
| 2009 | 63.0% | 66.0% | 44.0% |
| 2008 | 38.0% | 60.0% | 41.0% |
| CST Geometry Test | |||
| 2010 | 12.0% | 31.0% | 14.0% |
| 2009 | 6.0% | 33.0% | 14.0% |
| 2008 | 8.0% | 28.0% | 12.0% |
| CST Science Test | |||
| 2010 | 47.0% | 66.0% | 46.0% |
| 2009 | 56.0% | 67.0% | 44.0% |
| 2008 | 23.0% | 58.0% | 40.0% |
| CST World History Test | |||
| 2010 | 49.0% | 64.0% | 42.0% |
| 2009 | 33.0% | 62.0% | 38.0% |
| 2008 | 26.0% | 61.0% | 33.0% |
| CST Integrated/Coordinated Science Test | |||
| 2009 | 25.0% | - | 9.0% |
Grade 11 - % of students at or above proficiency
| School | District | State | |
|---|---|---|---|
| CST English-Language Arts Test | |||
| 2010 | 75.0% | 59.0% | 42.0% |
| 2009 | 53.0% | 61.0% | 40.0% |
| 2008 | 50.0% | 55.0% | 37.0% |
| CST U.S. History Test | |||
| 2010 | 66.0% | 67.0% | 45.0% |
| 2009 | 45.0% | 68.0% | 44.0% |
| 2008 | 32.0% | 61.0% | 38.0% |
| CST Geometry Test | |||
| 2009 | 7.0% | 11.0% | 7.0% |
| 2008 | 9.0% | 14.0% | 6.0% |
| CST Integrated/Coordinated Science Test | |||
| 2009 | 30.0% | - | 11.0% |
End of Course - % of students at or above proficiency
| School | District | State | |
|---|---|---|---|
| CST Algebra I Test | |||
| 2010 | 19.0% | 61.0% | 31.0% |
| 2009 | 24.0% | 63.0% | 28.0% |
| 2008 | 16.0% | 54.0% | 25.0% |
| CST Algebra II Test | |||
| 2010 | 15.0% | 45.0% | 31.0% |
| 2009 | 23.0% | 42.0% | 28.0% |
| CST Biology Test | |||
| 2010 | 40.0% | 81.0% | 46.0% |
| 2009 | 45.0% | 79.0% | 42.0% |
| 2008 | 34.0% | 79.0% | 42.0% |
| CST Chemistry Test | |||
| 2010 | 35.0% | 66.0% | 38.0% |
| 2009 | 37.0% | 68.0% | 36.0% |
| 2008 | 6.0% | 66.0% | 32.0% |
| CST Earth Science Test | |||
| 2010 | 54.0% | 49.0% | 33.0% |
| 2009 | 39.0% | 42.0% | 28.0% |
| CST General Mathematics Test | |||
| 2010 | 35.0% | 48.0% | 27.0% |
| 2009 | 19.0% | 51.0% | 26.0% |
| 2008 | 26.0% | 51.0% | 27.0% |
| CST Geometry Test | |||
| 2010 | 24.0% | 51.0% | 27.0% |
| 2009 | 24.0% | 54.0% | 26.0% |
| 2008 | 19.0% | 51.0% | 24.0% |
| CST Summative High School Math Test | |||
| 2010 | 64.0% | 78.0% | 54.0% |
| CST World History Test | |||
| 2010 | 43.0% | 66.0% | 41.0% |
| 2009 | 32.0% | 64.0% | 38.0% |
| 2008 | 29.0% | 63.0% | 33.0% |
| CST Integrated/Coordinated Science Test | |||
| 2009 | 27.0% | - | 13.0% |
| 2008 | 31.0% | - | 11.0% |
School Map and Similar Schools Nearby
| Opportunities for Learning School KG-12 | 103 Students | 5.6 miles away | Not Yet Rated | |
School Community Forum

Join a discussion about Capistrano Connections Academy and talk to others in the community including students, parents, teachers, and administrators.
- Admissions and Registration Questions (e.g. Dress Code and Discipline Policy)
- School Calendar and Upcoming Events (e.g. Graduation)
- After School Programs, Extracurricular Activities, and Athletics (e.g. Football)
- News and Announcements (e.g. Yearbook and Class Supply List Details)
- Graduate and Alumni Events (e.g. Organizing Class Reunions)
Between September 26 and October 2, 2006, there were three deadly school shootings and...
Many parents believe that kids don't experience stress. Nothing could be further from the truth....
Teacher Tenure (the policy making it almost impossible to fire teachers) has noble roots. It was...
