Opportunities for Learning School
Rating
Not Available
Not Available

No Reviews Yet
Find Old Friends From Opportunities for Learning School
Use the form below to search for alumni from Opportunities for Learning School.
School Description
School Summary and Highlights
- Enrolls 103 elementary, middle, and high school students from grades KG-12
- Ranks 573rd out of 1,197 high schools in CA.
- 2010 Overall School AYP Met Status: Yes
Additional Contact Information
- Mailing Address: 33621 Del Obispo St., Dana Point, CA 92629
School Operational Details
- Charter School
School District Details
- Capistrano Unified School District
- Per-Pupil Spending: $7,974
- Graduation Rate: 86.2%
- Dropout Rate: 0.9%
- Students Per Teacher: 26.3
- Enrolled Students: 53,344
Faculty Details and Student Enrollment
Students and Faculty
- Total Students Enrolled: 103
- Total Full Time "Equivalent" Teachers: 6.0
- Average Student-To-Teacher Ratio: 17.2
Students Gender Breakdown
- Males: 47 (45.6%)
- Females: 56 (54.4%)
Student Enrollment Distribution by Race / Ethnicity
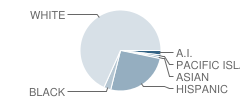
| Number | Percent | |
|---|---|---|
| American Indian | 2 | 1.9% |
| Black | 3 | 2.9% |
| Asian | 1 | 1.0% |
| Hispanic | 25 | 24.3% |
| White | 66 | 64.1% |
Number of Students Per Grade

| Number | Percent | |
|---|---|---|
| 9th Grade | 12 | 11.7% |
| 10th Grade | 29 | 28.2% |
| 11th Grade | 28 | 27.2% |
| 12th Grade | 34 | 33.0% |
Teacher Education Background (2009)
Percent With Master's Degree
School:
16.7%
District:
6.0%
Teacher Credentials & Experience (2009)
Percent of Teachers With Credentials: 100.0%
Number of Certificated Staff: 6.0
Average Number of Years of Teacher Experience: 6.8
Average Age
School:
39.2
District:
46.0
Source: CA Department of Education, Source: NCES 2009-2010
School Ratings and Reviews
Be The First To Review Opportunities for Learning School!
School Map and Similar Schools Nearby
Click to Activate Map of Nearby School Campuses
Private
Public
This School
Similar Schools Nearby
| Capistrano Connections Academy KG-12 | 1,020 Students | 5.6 miles away | Not Yet Rated | |
Compare This School To Nearby Schools ->
School Community Forum

Join a discussion about Opportunities for Learning School and talk to others in the community including students, parents, teachers, and administrators.
Popular Discussion Topics
- Admissions and Registration Questions (e.g. Dress Code and Discipline Policy)
- School Calendar and Upcoming Events (e.g. Graduation)
- After School Programs, Extracurricular Activities, and Athletics (e.g. Football)
- News and Announcements (e.g. Yearbook and Class Supply List Details)
- Graduate and Alumni Events (e.g. Organizing Class Reunions)
Navigation
Can't Find What You Are Looking For?
Rankings
Nearby Cities
Sponsored Links
K-12 Articles

The Adolescent Monster
"What happened to my sweet little baby?" Every parent has or will ask that sometime during the...
"What happened to my sweet little baby?" Every parent has or will ask that sometime during the...

Teaching Your Child Study Skills
Many children who have the capability to get good grades experience frustration because of low...
Many children who have the capability to get good grades experience frustration because of low...

Teaching Kids to Deal with Peer Pressure
Parents usually become very concerned when they hear the term "peer pressure." However, peer...
Parents usually become very concerned when they hear the term "peer pressure." However, peer...