Salt Creek Elementary School
Rating
Not Available
Not Available

4 out of 5 | 1 Review
Find Old Friends From Salt Creek Elementary School
Use the form below to search for alumni from Salt Creek Elementary School.
School Description
School Summary and Highlights
- Enrolls 922 elementary school students from grades KG-6
- Ranks 877th out of 5,423 elementary schools in CA.
- 2010 Overall School AYP Met Status: Yes
Additional Contact Information
- Mailing Address: 1055 Hunte Pkwy., Chula Vista, CA 91914
School District Details
- Chula Vista Elementary School District
- Per-Pupil Spending: $8,784
- Students Per Teacher: 19.4
- Enrolled Students: 27,465
Faculty Details and Student Enrollment
Students and Faculty
- Total Students Enrolled: 922
- Total Full Time "Equivalent" Teachers: 42.0
- Average Student-To-Teacher Ratio: 22.0
Students Gender Breakdown
- Males: 482 (52.3%)
- Females: 440 (47.7%)
Free Lunch Student Eligibility Breakdown
- Eligible for Reduced Lunch: 39 (4.2%)
- Eligible for Free Lunch: 52 (5.6%)
- Eligible for Either Reduced or Free Lunch: 91 (9.9%)
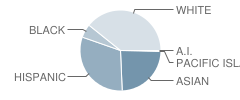
Student Enrollment Distribution by Race / Ethnicity
| Number | Percent | |
|---|---|---|
| American Indian | 2 | 0.2% |
| Black | 50 | 5.4% |
| Asian | 219 | 23.8% |
| Hispanic | 284 | 30.8% |
| White | 359 | 38.9% |
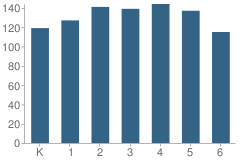
Number of Students Per Grade
| Number | Percent | |
|---|---|---|
| Kindergarten | 119 | 12.9% |
| 1st Grade | 127 | 13.8% |
| 2nd Grade | 141 | 15.3% |
| 3rd Grade | 139 | 15.1% |
| 4th Grade | 144 | 15.6% |
| 5th Grade | 137 | 14.9% |
| 6th Grade | 115 | 12.5% |
Teacher Education Background (2009)
Percent With Ph.D.
School:
2.1%
District:
12.1%
Percent With Master's Degree
School:
58.3%
District:
62.1%
Percent With Bachelor's Degree
School:
39.6%
District:
24.1%
Teacher Credentials & Experience (2009)
Percent of Teachers With Credentials: 100.0%
Number of Certificated Staff: 48.0
Average Number of Years of Teacher Experience: 6.5
Average Age
School:
36.8
District:
43.7
Source: CA Department of Education, Source: NCES 2009-2010
School Ratings and Reviews
Overall Rating: 4

4 out of 5 | 1 Review
The Overall Rating is the school's average rating from parents, students, school faculty and staff. The highest rating is five apples and the lowest is one apple.
Share Your Review About This School
1 review for Salt Creek Elementary School
- Reviewed by Community Member on April 21, 2009
- Rating:
 (4 / 5) Flag as inappropriate
 - Since Dr. Glover took over as the principal of Salt Creek, the transformation of school morale has been clearly evident. Teachers are smiling and not afraid of their own shadow, students are actively engaged in fun and challenging academics, and parents are encouraged to become positive members of the academic community. Happy teachers= happy students.
But do parents really know what teachers sacrifice to be remain teachers in that district? Parents need to ask questions about whether or not their child's teacher even has a contract and what about the health benefits that those teacher's families need to have? Are parents as informed about the challenges that the teachers face as they are about the education of their children? Teachers across the state need their students' parents to ask questions and get informed about teacher contracts and their poor health benefits.
School Map and Similar Schools Nearby
Click to Activate Map of Nearby School Campuses
Private
Public
This School
Similar Schools Nearby
| Olympic View Elementary School KG-6 | 789 Students | 1.2 miles away |  5 out of 5 | |
| Thurgood Marshall Elementary School KG-6 | 737 Students | 1.3 miles away | Not Yet Rated | |
| Liberty Elementary School KG-6 | 682 Students | 2.0 miles away | Not Yet Rated | |
| Eastlake Elementary School KG-6 | 626 Students | 2.2 miles away | Not Yet Rated | |
| Veterans Elementary School KG-6 | 708 Students | 2.4 miles away | Not Yet Rated | |
| Corky Mcmillin Elementary School KG-6 | 843 Students | 2.4 miles away | 5 out of 5 | |
| Burton C. Tiffany Elementary School KG-6 | 599 Students | 2.4 miles away | Not Yet Rated | |
| Wolf Canyon Elementary School KG-6 | 632 Students | 3.0 miles away | 5 out of 5 | - |
| Heritage Elementary School KG-6 | 870 Students | 3.1 miles away | Not Yet Rated | |
| Chula Vista Hills Elementary School KG-6 | 574 Students | 3.2 miles away | Not Yet Rated | |
Compare This School To Nearby Schools ->
School Community Forum

Join a discussion about Salt Creek Elementary School and talk to others in the community including students, parents, teachers, and administrators.
Popular Discussion Topics
- Admissions and Registration Questions (e.g. Dress Code and Discipline Policy)
- School Calendar and Upcoming Events (e.g. Graduation)
- After School Programs, Extracurricular Activities, and Athletics (e.g. Football)
- News and Announcements (e.g. Yearbook and Class Supply List Details)
- Graduate and Alumni Events (e.g. Organizing Class Reunions)
Navigation
Can't Find What You Are Looking For?
Rankings
Nearby Cities
Sponsored Links
K-12 Articles

The Impact on Adopted Children at School
Children who are adopted can be affected both academically and socially at school. Many times...
Children who are adopted can be affected both academically and socially at school. Many times...

Public or Private?
Daniel attended private school until sixth grade, when he was diagnosed with Asperger's Syndrome, a...
Daniel attended private school until sixth grade, when he was diagnosed with Asperger's Syndrome, a...

Educators and Childhood Obesity
Obesity in childhood is rising to epidemic proportions in America and educators should be...
Obesity in childhood is rising to epidemic proportions in America and educators should be...