Summit Leadership Academy-High Desert
Rating
Not Available
Not Available

5 out of 5 | 1 Review
Find Old Friends From Summit Leadership Academy-High Desert
Use the form below to search for alumni from Summit Leadership Academy-High Desert.
School Description
School Summary and Highlights
- Enrolls 189 high school students from grades 9-12
- Ranks 634th out of 1,197 high schools in CA.
- 2010 Overall School AYP Met Status: No
School Operational Details
- Charter School
School District Details
- Hesperia Unified School District
- Per-Pupil Spending: $7,795
- Graduation Rate: 74.7%
- Dropout Rate: 4.8%
- Students Per Teacher: 26.6
- Enrolled Students: 22,821
Faculty Details and Student Enrollment
Students and Faculty
- Total Students Enrolled: 189
- Total Full Time "Equivalent" Teachers: 8.0
- Average Student-To-Teacher Ratio: 23.6
Students Gender Breakdown
- Males: 123 (65.1%)
- Females: 66 (34.9%)
Student Enrollment Distribution by Race / Ethnicity
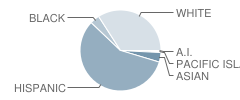
| Number | Percent | |
|---|---|---|
| American Indian | 1 | 0.5% |
| Black | 7 | 3.7% |
| Asian | 7 | 3.7% |
| Hispanic | 101 | 53.4% |
| White | 60 | 31.7% |
Number of Students Per Grade
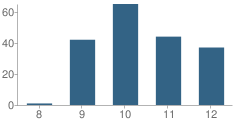
| Number | Percent | |
|---|---|---|
| 8th Grade | 1 | 0.5% |
| 9th Grade | 42 | 22.2% |
| 10th Grade | 65 | 34.4% |
| 11th Grade | 44 | 23.3% |
| 12th Grade | 37 | 19.6% |
Teacher Education Background (2009)
Percent With Master's Degree
School:
30.0%
District:
51.1%
Percent With Bachelor's Degree
School:
20.0%
District:
10.6%
Teacher Credentials & Experience (2009)
Percent of Teachers With Emergency Credentials: 22.2%
Percent of Teachers With Credentials: 55.6%
Number of Certificated Staff: 10.0
Average Number of Years of Teacher Experience: 3.1
Average Age
School:
37.7
District:
44.9
Source: CA Department of Education, Source: NCES 2009-2010
School Ratings and Reviews
Overall Rating: 5

5 out of 5 | 1 Review
The Overall Rating is the school's average rating from parents, students, school faculty and staff. The highest rating is five apples and the lowest is one apple.
Share Your Review About This School
1 review for Summit Leadership Academy-High Desert
- Reviewed by Parent/Guardian on July 02, 2009
- Rating:
 (5 / 5) Flag as inappropriate
 - This has to be one of the best schools anyone can send their high school child to. The program and the staff are incredible. The students learn honor, discipline, and respect. They also get training in either the area of Police, Fire, or military training. TERRIFIC!
School Map and Similar Schools Nearby
Click to Activate Map of Nearby School Campuses
Private
Public
This School
Similar Schools Nearby
| Mirus Secondary School 7-12 | 172 Students | 1.7 miles away | Not Yet Rated | - |
| Options for Youth-Victorville Charter School 7-12 | 2,018 Students | 4.8 miles away | Not Yet Rated | |
| Encore High School for the Performing and Visual Arts 7-12 | 620 Students | 5.5 miles away |  5 out of 5 | - |
| Alta Vista Public School KG-12 | 171 Students | 6.4 miles away | Not Yet Rated | - |
| Crosswalk: Hesperia Experiential Learning Pathways School 9-12 | 88 Students | 7.9 miles away | 5 out of 5 | |
| High Desert Academy of Applied Arts and Sciences 7-12 | 102 Students | 9.0 miles away | Not Yet Rated | |
| Academy for Academic Excellence KG-12 | 1,335 Students | 10.2 miles away | Not Yet Rated | |
| Riverside Preparatory School KG-12 | 1,035 Students | 13.2 miles away | 5 out of 5 | - |
| Provisional Accelerated Learning Academy 9-12 | 256 Students | 18.2 miles away | Not Yet Rated | |
Compare This School To Nearby Schools ->
School Community Forum

Join a discussion about Summit Leadership Academy-High Desert and talk to others in the community including students, parents, teachers, and administrators.
Popular Discussion Topics
- Admissions and Registration Questions (e.g. Dress Code and Discipline Policy)
- School Calendar and Upcoming Events (e.g. Graduation)
- After School Programs, Extracurricular Activities, and Athletics (e.g. Football)
- News and Announcements (e.g. Yearbook and Class Supply List Details)
- Graduate and Alumni Events (e.g. Organizing Class Reunions)
Navigation
Can't Find What You Are Looking For?
Rankings
Nearby Cities
Sponsored Links
K-12 Articles

Helping Your Child Leave the Nest
It's all come down to this: Eighteen years of good times and bad, and now your baby bird is ready...
It's all come down to this: Eighteen years of good times and bad, and now your baby bird is ready...

Does Your Child's Teacher Make a Difference
School improvement is always in the news. Teachers demand smaller class sizes. The government calls...
School improvement is always in the news. Teachers demand smaller class sizes. The government calls...

Bullies... What Are They Good For?
Bullies have been around since the beginning of time. We had to deal with bullies, and our parents...
Bullies have been around since the beginning of time. We had to deal with bullies, and our parents...