Heritage College-Ready High School
Rating
Not Available
Not Available

No Reviews Yet
Find Old Friends From Heritage College-Ready High School
Use the form below to search for alumni from Heritage College-Ready High School.
School Description
School Summary and Highlights
- Enrolls 537 high school students from grades 9-12
- Ranks 864th out of 1,197 high schools in CA.
- 2010 Overall School AYP Met Status: Yes
Additional Contact Information
- Mailing Address: 2023 South Union Ave., Los Angeles, CA 90007
School Operational Details
- Title I EligibleAll students of this school are eligible for participation in authorized programs.
- Charter School
School District Details
- Los Angeles Unified School District
- Per-Pupil Spending: $11,357
- Graduation Rate: 48.8%
- Dropout Rate: 6.8%
- Students Per Teacher: 21.3
- Enrolled Students: 667,870
Faculty Details and Student Enrollment
Students and Faculty
- Total Students Enrolled: 537
- Total Full Time "Equivalent" Teachers: 23.0
- Average Student-To-Teacher Ratio: 23.4
Students Gender Breakdown
- Males: 231 (43.0%)
- Females: 306 (57.0%)
Free Lunch Student Eligibility Breakdown
- Eligible for Reduced Lunch: 5 (0.9%)
- Eligible for Free Lunch: 516 (96.1%)
- Eligible for Either Reduced or Free Lunch: 521 (97.0%)
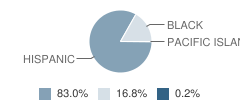
Student Enrollment Distribution by Race / Ethnicity
| Number | Percent | |
|---|---|---|
| American Indian | - | - |
| Black | 90 | 16.8% |
| Asian | - | - |
| Hispanic | 445 | 82.9% |
| White | - | - |
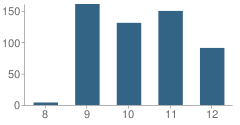
Number of Students Per Grade
| Number | Percent | |
|---|---|---|
| 8th Grade | 4 | 0.7% |
| 9th Grade | 161 | 30.0% |
| 10th Grade | 131 | 24.4% |
| 11th Grade | 150 | 27.9% |
| 12th Grade | 91 | 16.9% |
Graduates Information (2010)
Graduation Rate
School:
91.6%
District:
69.1%
State:
78.6%
Teacher Education Background (2009)
Percent With Master's Degree
School:
24.1%
District:
26.9%
Percent With Bachelor's Degree
School:
13.8%
District:
31.9%
Percent With Ph.D.
School:
3.4%
District:
3.7%
Teacher Credentials & Experience (2009)
Average Age
School:
46.3
District:
46.7
Average Number of Years of Teacher Experience: 5.0
Number of Certificated Staff: 29.0
Percent of Teachers With Credentials: 64.0%
Percent of Teachers With Emergency Credentials: 4.0%
Source: CA Department of Education, Source: NCES 2009-2010
School Ratings and Reviews
Be The First To Review Heritage College-Ready High School!
School Map and Similar Schools Nearby
Click to Activate Map of Nearby School Campuses
Private
Public
This School
Similar Schools Nearby
| Animo Locke Ace Academy 9-12 | 117 Students | 0.9 miles away | Not Yet Rated | - |
| Legacy Charter High School 9-12 | 67 Students | 1.0 miles away | Not Yet Rated | - |
| Opportunities Unlimited Charter High School 9-12 | 75 Students | 1.1 miles away | Not Yet Rated | - |
| Animo Jefferson High 5 School 9-12 | 410 Students | 1.3 miles away | Not Yet Rated | |
| Animo Downtown Charter High School 9-12 | 526 Students | 2.1 miles away | Not Yet Rated | |
| Animo Jefferson High 6 School 9-12 | 416 Students | 2.1 miles away | Not Yet Rated | |
| Animo South Los Angeles Charter School 9-12 | 537 Students | 2.2 miles away | Not Yet Rated | |
| Health Services Academy High 9-12 | 142 Students | 2.6 miles away | Not Yet Rated | - |
| Aspire L. A. Secondary Charter School 6-12 | 515 Students | 3.1 miles away |  5 out of 5 | |
| Huntington Park College-Ready Academy 9-12 | 526 Students | 3.1 miles away |  4 out of 5 | |
Compare This School To Nearby Schools ->
School Community Forum

Join a discussion about Heritage College-Ready High School and talk to others in the community including students, parents, teachers, and administrators.
Popular Discussion Topics
- Admissions and Registration Questions (e.g. Dress Code and Discipline Policy)
- School Calendar and Upcoming Events (e.g. Graduation)
- After School Programs, Extracurricular Activities, and Athletics (e.g. Football)
- News and Announcements (e.g. Yearbook and Class Supply List Details)
- Graduate and Alumni Events (e.g. Organizing Class Reunions)
Navigation
Can't Find What You Are Looking For?
Rankings
Nearby Cities
Sponsored Links
K-12 Articles

Beating the Summer Slump
“The Summer Slump”, teachers call it. It happens every year. It makes its way into lesson plans...
“The Summer Slump”, teachers call it. It happens every year. It makes its way into lesson plans...

Cell Phones... the Best Thing Since Sliced Bread or the Worst Invention in the World?
Cell phones are wonderful, the best things humans have ever invented! They help us keep in touch...
Cell phones are wonderful, the best things humans have ever invented! They help us keep in touch...

Is Your Child's Teacher a Bully?
We’ve all heard about kids being bullied by peers. Kids taunt, tease, pull hair, shove and push...
We’ve all heard about kids being bullied by peers. Kids taunt, tease, pull hair, shove and push...