Huntington Park College-Ready Academy
Rating
Not Available
Not Available

4 out of 5 | 1 Review
Find Old Friends From Huntington Park College-Ready Academy
Use the form below to search for alumni from Huntington Park College-Ready Academy.
School Description
School Summary and Highlights
- Enrolls 526 high school students from grades 9-12
- Ranks 373rd out of 1,197 high schools in CA.
- 2010 Overall School AYP Met Status: No
Additional Contact Information
- Mailing Address: 2023 South Union Ave., Los Angeles, CA 90007
School Operational Details
- Title I EligibleAll students of this school are eligible for participation in authorized programs.
- Charter School
School District Details
- Los Angeles Unified School District
- Per-Pupil Spending: $11,357
- Graduation Rate: 48.8%
- Dropout Rate: 6.8%
- Students Per Teacher: 21.3
- Enrolled Students: 667,870
Faculty Details and Student Enrollment
Students and Faculty
- Total Students Enrolled: 526
- Total Full Time "Equivalent" Teachers: 28.0
- Average Student-To-Teacher Ratio: 18.8
Students Gender Breakdown
- Males: 248 (47.1%)
- Females: 278 (52.9%)
Free Lunch Student Eligibility Breakdown
- Eligible for Reduced Lunch: 70 (13.3%)
- Eligible for Free Lunch: 406 (77.2%)
- Eligible for Either Reduced or Free Lunch: 476 (90.5%)
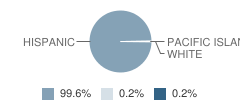
Student Enrollment Distribution by Race / Ethnicity
| Number | Percent | |
|---|---|---|
| American Indian | - | - |
| Black | - | - |
| Asian | - | - |
| Hispanic | 524 | 99.6% |
| White | 1 | 0.2% |
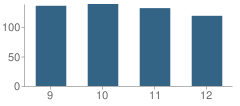
Number of Students Per Grade
| Number | Percent | |
|---|---|---|
| 9th Grade | 136 | 25.9% |
| 10th Grade | 139 | 26.4% |
| 11th Grade | 132 | 25.1% |
| 12th Grade | 119 | 22.6% |
Graduates Information (2010)
Graduation Rate
School:
97.1%
District:
69.1%
State:
78.6%
Teacher Education Background (2009)
Percent With Bachelor's Degree
School:
23.1%
District:
31.9%
Percent With Master's Degree
School:
15.4%
District:
26.9%
Teacher Credentials & Experience (2009)
Average Age
School:
39.8
District:
46.7
Average Number of Years of Teacher Experience: 3.4
Number of Certificated Staff: 26.0
Percent of Teachers With Credentials: 84.0%
Source: CA Department of Education, Source: NCES 2009-2010
School Ratings and Reviews
Overall Rating: 4

4 out of 5 | 1 Review
The Overall Rating is the school's average rating from parents, students, school faculty and staff. The highest rating is five apples and the lowest is one apple.
Share Your Review About This School
1 review for Huntington Park College-Ready Academy
- Reviewed by Parent/Guardian on August 31, 2009
- Rating:
 (4 / 5) Flag as inappropriate
 - This school is one of the best things Huntington Park has had in a very long time. After seeing the overpopulated schools in the area, I needed something smaller for my incoming daughter. Coming from a small Christian school, I was worried about the environment. But our principal is awesome at disciplinary matters and also truly cares about our students following strict academic standards. Thank you Mrs. Galvan
School Map and Similar Schools Nearby
Click to Activate Map of Nearby School Campuses
Private
Public
This School
Similar Schools Nearby
| Aspire L. A. Secondary Charter School 6-12 | 515 Students | 0.04 miles away |  5 out of 5 | |
| Animo Downtown Charter High School 9-12 | 526 Students | 1.1 miles away | Not Yet Rated | |
| Animo Jefferson High 3 School 9-12 | 492 Students | 2.5 miles away | Not Yet Rated | |
| Wooden Secondary Charter Academy 9-11 | 174 Students | 2.8 miles away | Not Yet Rated | |
| Fernando Pullum Performing Arts High School 9-12 | 131 Students | 2.8 miles away | Not Yet Rated | - |
| Heritage College-Ready High School 9-12 | 537 Students | 3.1 miles away | Not Yet Rated | |
| Wallis Annenberg High School 9-12 | 288 Students | 3.2 miles away | Not Yet Rated | |
| Animo Jefferson High 5 School 9-12 | 410 Students | 3.4 miles away | Not Yet Rated | |
| Animo Film and Theater Arts Charter High School 9-12 | 162 Students | 3.5 miles away | Not Yet Rated | |
| Animo Locke Ace Academy 9-12 | 117 Students | 3.6 miles away | Not Yet Rated | - |
Compare This School To Nearby Schools ->
School Community Forum

Join a discussion about Huntington Park College-Ready Academy and talk to others in the community including students, parents, teachers, and administrators.
Popular Discussion Topics
- Admissions and Registration Questions (e.g. Dress Code and Discipline Policy)
- School Calendar and Upcoming Events (e.g. Graduation)
- After School Programs, Extracurricular Activities, and Athletics (e.g. Football)
- News and Announcements (e.g. Yearbook and Class Supply List Details)
- Graduate and Alumni Events (e.g. Organizing Class Reunions)
Navigation
Can't Find What You Are Looking For?
Rankings
Nearby Cities
Sponsored Links
K-12 Articles

A Cheat Sheet on Cheating
Senior projects are coming due and finals are coming up. Spring has sprung, and with spring comes...
Senior projects are coming due and finals are coming up. Spring has sprung, and with spring comes...

The Very Best Things in the World
A recent poll in the U.K. revealed that children view the “very best thing in the world” as being...
A recent poll in the U.K. revealed that children view the “very best thing in the world” as being...

The Impact on Adopted Children at School
Children who are adopted can be affected both academically and socially at school. Many times...
Children who are adopted can be affected both academically and socially at school. Many times...