International Studies Learning Community School

No Reviews Yet
Find Old Friends From International Studies Learning Community School
Use the form below to search for alumni from International Studies Learning Community School.
School Description
School Summary and Highlights
- Enrolls 782 middle and high school students from grades 6-12
- Ranks 879th out of 1,197 high schools in CA.
- 2010 Overall School AYP Met Status: No
Additional Contact Information
- Mailing Address: 2701 Sequoia Dr., South Gate, CA 90280
School Operational Details
- Title I EligibleAll students of this school are eligible for participation in authorized programs.
School District Details
- Los Angeles Unified School District
- Per-Pupil Spending: $11,357
- Graduation Rate: 48.8%
- Dropout Rate: 6.8%
- Students Per Teacher: 21.3
- Enrolled Students: 667,870
Faculty Details and Student Enrollment
Students and Faculty
- Total Students Enrolled: 782
- Total Full Time "Equivalent" Teachers: 32.1
- Average Student-To-Teacher Ratio: 24.4
Students Gender Breakdown
- Males: 354 (45.3%)
- Females: 428 (54.7%)
Free Lunch Student Eligibility Breakdown
- Eligible for Reduced Lunch: 47 (6.0%)
- Eligible for Free Lunch: 517 (66.1%)
- Eligible for Either Reduced or Free Lunch: 564 (72.1%)
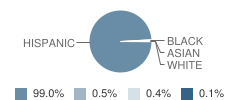
Student Enrollment Distribution by Race / Ethnicity

| Number | Percent | |
|---|---|---|
| American Indian | - | - |
| Black | 4 | 0.5% |
| Asian | 1 | 0.1% |
| Hispanic | 773 | 98.8% |
| White | 3 | 0.4% |
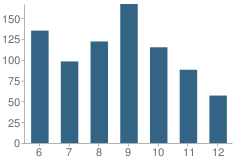
Number of Students Per Grade

| Number | Percent | |
|---|---|---|
| 6th Grade | 135 | 17.3% |
| 7th Grade | 98 | 12.5% |
| 8th Grade | 122 | 15.6% |
| 9th Grade | 167 | 21.4% |
| 10th Grade | 115 | 14.7% |
| 11th Grade | 88 | 11.3% |
| 12th Grade | 57 | 7.3% |
Graduates Information (2010)
Graduation Rate
School:
92.9%
District:
69.1%
State:
78.6%
Teacher Education Background (2009)
Percent With Ph.D.
School:
2.4%
District:
3.7%
Percent With Master's Degree
School:
7.3%
District:
26.9%
Percent With Bachelor's Degree
School:
17.1%
District:
31.9%
Teacher Credentials & Experience (2009)
Percent of Teachers With Credentials: 94.1%
Number of Certificated Staff: 41.0
Average Number of Years of Teacher Experience: 6.6
Average Age
School:
40.5
District:
46.7
Source: CA Department of Education, Source: NCES 2009-2010
School Ratings and Reviews
Be The First To Review International Studies Learning Community School!
Sponsored Links
Test Scores and Performance Information
Overall School Rating
How is this determined?
The overall school rating shows that International Studies Learning Community School performed on average worse than many other schools across the state on CST state exams in the following subjects:
- CST Algebra I
- CST Algebra II
- CST Biology
- CST Chemistry
- CST English-Language Arts
- CST General Mathematics
- CST Geometry
- CST History - Social Science
- CST Integrated/Coordinated Science
- CST Mathematics
- CST Science
- CST Summative High School Math
- CST U.S. History
- CST World History
AYP Results (2010)
Overall AYP Met: No
ELA AYP Met: No
Math AYP Met: No
Program Improvement (PI) Requirement Under NCLB (2010)
First Year PI Requirement was Implemented: 2006-2007
School's Placement Under NCLB: Year 5
ACT Exam Results (2009)
Percent of Students Taking ACT Exam: 9.7%
SAT Exam Results (2009)
Percent of Students Taking SAT Exam: 74.2%
Average Combined Score: 1,241.5
Critical Reading Average: 414.6
Math Average: 408.9
Writing Average: 418.0
Percent Scoring At or Above 1500: 13.0%
CST - Test Proficiency by Grade and Subject
Grade 6 - % of students at or above proficiency
| School | District | State | |
|---|---|---|---|
| CST English-Language Arts Test | |||
| 2010 | 40.0% | 39.0% | 55.0% |
| 2009 | 30.0% | 37.0% | 52.0% |
| 2008 | 32.0% | 33.0% | 47.0% |
| CST Mathematics Test | |||
| 2010 | 37.0% | 39.0% | 52.0% |
| 2009 | 22.0% | 35.0% | 49.0% |
| 2008 | 27.0% | 31.0% | 44.0% |
Grade 7 - % of students at or above proficiency
| School | District | State | |
|---|---|---|---|
| CST Algebra I Test | |||
| 2010 | 62.0% | 79.0% | 84.0% |
| 2009 | 36.0% | 72.0% | 81.0% |
| CST English-Language Arts Test | |||
| 2010 | 29.0% | 39.0% | 55.0% |
| 2009 | 27.0% | 38.0% | 54.0% |
| 2008 | 31.0% | 34.0% | 49.0% |
| CST Mathematics Test | |||
| 2010 | 22.0% | 34.0% | 48.0% |
| 2009 | 11.0% | 27.0% | 43.0% |
| 2008 | 31.0% | 28.0% | 41.0% |
Grade 8 - % of students at or above proficiency
| School | District | State | |
|---|---|---|---|
| CST Algebra I Test | |||
| 2010 | 10.0% | 32.0% | 46.0% |
| 2009 | 7.0% | 28.0% | 44.0% |
| 2008 | 37.0% | 26.0% | 42.0% |
| CST English-Language Arts Test | |||
| 2010 | 31.0% | 37.0% | 54.0% |
| 2009 | 28.0% | 31.0% | 48.0% |
| 2008 | 34.0% | 31.0% | 45.0% |
| CST General Mathematics Test | |||
| 2010 | 20.0% | 22.0% | 30.0% |
| 2009 | 15.0% | 18.0% | 30.0% |
| 2008 | 7.0% | 16.0% | 31.0% |
| CST Geometry Test | |||
| 2010 | 17.0% | 80.0% | 85.0% |
| CST History - Social Science Test | |||
| 2010 | 32.0% | 35.0% | 47.0% |
| 2009 | 30.0% | 30.0% | 42.0% |
| 2008 | 25.0% | 25.0% | 36.0% |
| CST Science Test | |||
| 2010 | 55.0% | 46.0% | 59.0% |
| 2009 | 47.0% | 41.0% | 56.0% |
| 2008 | 40.0% | 40.0% | 52.0% |
Grade 9 - % of students at or above proficiency
| School | District | State | |
|---|---|---|---|
| CST Algebra I Test | |||
| 2010 | 4.0% | 11.0% | 22.0% |
| 2009 | 1.0% | 10.0% | 21.0% |
| CST Biology Test | |||
| 2010 | 47.0% | 27.0% | 55.0% |
| 2009 | 72.0% | 23.0% | 51.0% |
| 2008 | 8.0% | 25.0% | 52.0% |
| CST English-Language Arts Test | |||
| 2010 | 43.0% | 36.0% | 54.0% |
| 2009 | 40.0% | 32.0% | 50.0% |
| 2008 | 33.0% | 31.0% | 49.0% |
| CST Geometry Test | |||
| 2010 | 27.0% | 21.0% | 46.0% |
| 2009 | 21.0% | 23.0% | 47.0% |
| 2008 | 12.0% | 19.0% | 43.0% |
| CST Integrated/Coordinated Science Test | |||
| 2010 | 6.0% | 13.0% | 19.0% |
| 2009 | 8.0% | 9.0% | 15.0% |
| 2008 | 6.0% | 7.0% | 5.0% |
| CST World History Test | |||
| 2008 | 9.0% | 15.0% | 36.0% |
Grade 10 - % of students at or above proficiency
| School | District | State | |
|---|---|---|---|
| CST Algebra II Test | |||
| 2010 | 20.0% | 21.0% | 40.0% |
| 2009 | 13.0% | 18.0% | 37.0% |
| 2008 | 3.0% | 17.0% | 36.0% |
| CST Biology Test | |||
| 2010 | 43.0% | 29.0% | 38.0% |
| 2009 | 33.0% | 24.0% | 34.0% |
| 2008 | 37.0% | 23.0% | 35.0% |
| CST Chemistry Test | |||
| 2010 | 18.0% | 17.0% | 47.0% |
| CST English-Language Arts Test | |||
| 2010 | 48.0% | 33.0% | 45.0% |
| 2009 | 36.0% | 31.0% | 44.0% |
| 2008 | 37.0% | 29.0% | 41.0% |
| CST Geometry Test | |||
| 2010 | 4.0% | 6.0% | 14.0% |
| 2009 | 2.0% | 6.0% | 14.0% |
| CST Science Test | |||
| 2010 | 41.0% | 32.0% | 46.0% |
| 2009 | 37.0% | 30.0% | 44.0% |
| 2008 | 30.0% | 25.0% | 40.0% |
| CST World History Test | |||
| 2010 | 39.0% | 28.0% | 42.0% |
| 2009 | 21.0% | 24.0% | 38.0% |
| 2008 | 13.0% | 19.0% | 33.0% |
| CST Summative High School Math Test | |||
| 2008 | 12.0% | 44.0% | 68.0% |
Grade 11 - % of students at or above proficiency
| School | District | State | |
|---|---|---|---|
| CST Algebra II Test | |||
| 2010 | 2.0% | 6.0% | 14.0% |
| CST Chemistry Test | |||
| 2010 | 5.0% | 15.0% | 30.0% |
| 2009 | 16.0% | 13.0% | 27.0% |
| 2008 | 8.0% | 11.0% | 25.0% |
| CST English-Language Arts Test | |||
| 2010 | 47.0% | 34.0% | 42.0% |
| 2009 | 45.0% | 32.0% | 40.0% |
| 2008 | 40.0% | 27.0% | 37.0% |
| CST Summative High School Math Test | |||
| 2010 | 19.0% | 31.0% | 50.0% |
| 2009 | 8.0% | 27.0% | 47.0% |
| 2008 | 18.0% | 25.0% | 43.0% |
| CST U.S. History Test | |||
| 2010 | 49.0% | 33.0% | 45.0% |
| 2009 | 38.0% | 31.0% | 44.0% |
| 2008 | 34.0% | 25.0% | 38.0% |
End of Course - % of students at or above proficiency
| School | District | State | |
|---|---|---|---|
| CST Algebra I Test | |||
| 2010 | 9.0% | 22.0% | 31.0% |
| 2009 | 7.0% | 19.0% | 28.0% |
| 2008 | 8.0% | 17.0% | 25.0% |
| CST Algebra II Test | |||
| 2010 | 9.0% | 16.0% | 31.0% |
| 2009 | 6.0% | 15.0% | 28.0% |
| 2008 | 2.0% | 13.0% | 27.0% |
| CST Biology Test | |||
| 2010 | 46.0% | 28.0% | 46.0% |
| 2009 | 39.0% | 24.0% | 42.0% |
| 2008 | 32.0% | 24.0% | 42.0% |
| CST Chemistry Test | |||
| 2010 | 8.0% | 16.0% | 38.0% |
| 2009 | 15.0% | 14.0% | 36.0% |
| 2008 | 8.0% | 12.0% | 32.0% |
| CST General Mathematics Test | |||
| 2010 | 20.0% | 20.0% | 27.0% |
| 2009 | 15.0% | 17.0% | 26.0% |
| 2008 | 7.0% | 15.0% | 27.0% |
| CST Geometry Test | |||
| 2010 | 11.0% | 14.0% | 27.0% |
| 2009 | 7.0% | 14.0% | 26.0% |
| 2008 | 5.0% | 11.0% | 24.0% |
| CST Integrated/Coordinated Science Test | |||
| 2010 | 5.0% | 3.0% | 16.0% |
| 2009 | 8.0% | 7.0% | 13.0% |
| 2008 | 5.0% | 2.0% | 11.0% |
| CST Summative High School Math Test | |||
| 2010 | 19.0% | 35.0% | 54.0% |
| 2009 | 8.0% | 30.0% | 50.0% |
| 2008 | 16.0% | 29.0% | 47.0% |
| CST World History Test | |||
| 2010 | 38.0% | 27.0% | 41.0% |
| 2009 | 20.0% | 23.0% | 38.0% |
| 2008 | 12.0% | 18.0% | 33.0% |
Source: CA Department of Education 2009-2010
School Map and Similar Schools Nearby
Click to Activate Map of Nearby School Campuses
Private
Public
This School
Similar Schools Nearby
| South East High School 9-12 | 2,855 Students | 0.3 miles away | ![]() 5 out of 5 | |
| Jordan New Technology High School 9-12 | 237 Students | 0.3 miles away | Not Yet Rated | - |
| South Gate High School 9-12 | 3,289 Students | 1.2 miles away | ![]() 4.5 out of 5 | |
| Thurgood Marshall School KG-12 | 14 Students | 1.8 miles away | ![]() 5 out of 5 | - |
| Centennial High School 9-12 | 1,367 Students | 2.5 miles away | ![]() 4 out of 5 | |
| Elizabeth Learning Center School KG-12 | 2,117 Students | 2.8 miles away | Not Yet Rated | |
| Bell High School 9-12 | 4,301 Students | 3.0 miles away | ![]() 4.5 out of 5 | |
| Huntington Park High School 9-12 | 4,185 Students | 3.1 miles away | ![]() 2 out of 5 | |
| John C. Fremont High School 9-12 | 4,470 Students | 3.2 miles away | ![]() 5 out of 5 | |
| Maywood Academy High 9-12 | 1,343 Students | 3.5 miles away | ![]() 5 out of 5 | |
Compare This School To Nearby Schools ->
School Community Forum

Join a discussion about International Studies Learning Community School and talk to others in the community including students, parents, teachers, and administrators.
Popular Discussion Topics
- Admissions and Registration Questions (e.g. Dress Code and Discipline Policy)
- School Calendar and Upcoming Events (e.g. Graduation)
- After School Programs, Extracurricular Activities, and Athletics (e.g. Football)
- News and Announcements (e.g. Yearbook and Class Supply List Details)
- Graduate and Alumni Events (e.g. Organizing Class Reunions)
Navigation
Can't Find What You Are Looking For?
Rankings
Nearby Cities
Sponsored Links
K-12 Articles
School's out for Recess
Recess used to be the best part of school; that and lunch. But today, a shocking two-thirds of...
Help Your High School Student Create an Impressive Resume
Time has flown. Your teen is in high school and has demonstrated an interest in obtaining a part...
Grammar...not Just Extended Family Anymore!
Can I talk to y'all abit about grammar? Right grammar and punctuations got to be some of the...


