Santa Rosa Academy

No Reviews Yet
Find Old Friends From Santa Rosa Academy
Use the form below to search for alumni from Santa Rosa Academy.
School Description
School Summary and Highlights
- Enrolls 573 elementary, middle, and high school students from grades KG-12
- Ranks 750th out of 1,197 high schools in CA.
- 2010 Overall School AYP Met Status: No
Additional Contact Information
- Mailing Address: 28237 La Piedra Rd., Menifee, CA 92584
School Operational Details
- Charter School
School District Details
- Menifee Union Elementary School District
- Per-Pupil Spending: $7,240
- Dropout Rate: 9.2%
- Students Per Teacher: 22.8
- Enrolled Students: 9,430
Faculty Details and Student Enrollment
Students and Faculty
- Total Students Enrolled: 573
- Total Full Time "Equivalent" Teachers: 29.3
- Average Student-To-Teacher Ratio: 19.6
Students Gender Breakdown
- Males: 278 (48.5%)
- Females: 295 (51.5%)
Free Lunch Student Eligibility Breakdown
- Eligible for Reduced Lunch: 38 (6.6%)
- Eligible for Free Lunch: 69 (12.0%)
- Eligible for Either Reduced or Free Lunch: 107 (18.7%)
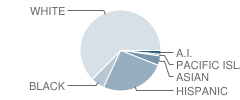
Student Enrollment Distribution by Race / Ethnicity

| Number | Percent | |
|---|---|---|
| American Indian | 10 | 1.7% |
| Black | 31 | 5.4% |
| Asian | 22 | 3.8% |
| Hispanic | 143 | 25.0% |
| White | 343 | 59.9% |
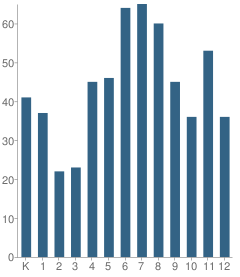
Number of Students Per Grade

| Number | Percent | |
|---|---|---|
| Kindergarten | 41 | 7.2% |
| 1st Grade | 37 | 6.5% |
| 2nd Grade | 22 | 3.8% |
| 3rd Grade | 23 | 4.0% |
| 4th Grade | 45 | 7.9% |
| 5th Grade | 46 | 8.0% |
| 6th Grade | 64 | 11.2% |
| 7th Grade | 65 | 11.3% |
| 8th Grade | 60 | 10.5% |
| 9th Grade | 45 | 7.9% |
| 10th Grade | 36 | 6.3% |
| 11th Grade | 53 | 9.2% |
| 12th Grade | 36 | 6.3% |
Teacher Education Background (2009)
Percent With Ph.D.
School:
3.3%
District:
4.2%
Percent With Master's Degree
School:
30.0%
District:
20.8%
Percent With Bachelor's Degree
School:
23.3%
District:
37.5%
Teacher Credentials & Experience (2009)
Percent of Teachers With Credentials: 96.4%
Number of Certificated Staff: 30.0
Average Number of Years of Teacher Experience: 8.0
Average Age
School:
35.1
District:
50.0
Source: CA Department of Education, Source: NCES 2009-2010
School Ratings and Reviews
Be The First To Review Santa Rosa Academy!
Sponsored Links
Test Scores and Performance Information
Overall School Rating
How is this determined?
The overall school rating shows that Santa Rosa Academy performed on average about the same as other schools across the state on CST state exams in the following subjects:
- CST Algebra I
- CST Algebra II
- CST Biology
- CST Chemistry
- CST English-Language Arts
- CST General Mathematics
- CST Geometry
- CST History - Social Science
- CST Mathematics
- CST Science
- CST U.S. History
- CST World History
AYP Results (2010)
Overall AYP Met: No
ELA AYP Met: No
Math AYP Met: Yes
CST - Test Proficiency by Grade and Subject
Grade 2 - % of students at or above proficiency
| School | District | State | |
|---|---|---|---|
| CST English-Language Arts Test | |||
| 2010 | 55.0% | 61.0% | 53.0% |
| 2009 | 30.0% | 58.0% | 53.0% |
| 2008 | 37.0% | 50.0% | 48.0% |
| CST Mathematics Test | |||
| 2010 | 64.0% | 73.0% | 62.0% |
| 2009 | 30.0% | 68.0% | 63.0% |
| 2008 | 37.0% | 61.0% | 59.0% |
Grade 3 - % of students at or above proficiency
| School | District | State | |
|---|---|---|---|
| CST English-Language Arts Test | |||
| 2010 | 48.0% | 51.0% | 43.0% |
| 2009 | 52.0% | 49.0% | 44.0% |
| 2008 | 45.0% | 42.0% | 38.0% |
| CST Mathematics Test | |||
| 2010 | 48.0% | 75.0% | 65.0% |
| 2009 | 60.0% | 69.0% | 64.0% |
| 2008 | 55.0% | 71.0% | 61.0% |
Grade 4 - % of students at or above proficiency
| School | District | State | |
|---|---|---|---|
| CST English-Language Arts Test | |||
| 2010 | 71.0% | 72.0% | 63.0% |
| 2009 | 50.0% | 71.0% | 61.0% |
| 2008 | 65.0% | 63.0% | 55.0% |
| CST Mathematics Test | |||
| 2010 | 69.0% | 74.0% | 68.0% |
| 2009 | 39.0% | 72.0% | 66.0% |
| 2008 | 70.0% | 72.0% | 61.0% |
Grade 5 - % of students at or above proficiency
| School | District | State | |
|---|---|---|---|
| CST English-Language Arts Test | |||
| 2010 | 54.0% | 68.0% | 58.0% |
| 2009 | 76.0% | 61.0% | 54.0% |
| 2008 | 69.0% | 50.0% | 48.0% |
| CST Mathematics Test | |||
| 2010 | 46.0% | 74.0% | 61.0% |
| 2009 | 48.0% | 63.0% | 57.0% |
| 2008 | 31.0% | 58.0% | 51.0% |
| CST Science Test | |||
| 2010 | 59.0% | 70.0% | 56.0% |
| 2009 | 46.0% | 58.0% | 49.0% |
| 2008 | 48.0% | 51.0% | 46.0% |
Grade 6 - % of students at or above proficiency
| School | District | State | |
|---|---|---|---|
| CST English-Language Arts Test | |||
| 2010 | 63.0% | 58.0% | 55.0% |
| 2009 | 62.0% | 54.0% | 52.0% |
| 2008 | 56.0% | 48.0% | 47.0% |
| CST Mathematics Test | |||
| 2010 | 53.0% | 49.0% | 52.0% |
| 2009 | 54.0% | 46.0% | 49.0% |
| 2008 | 43.0% | 42.0% | 44.0% |
Grade 7 - % of students at or above proficiency
| School | District | State | |
|---|---|---|---|
| CST English-Language Arts Test | |||
| 2010 | 69.0% | 58.0% | 55.0% |
| 2009 | 58.0% | 59.0% | 54.0% |
| 2008 | 55.0% | 51.0% | 49.0% |
| CST Mathematics Test | |||
| 2010 | 32.0% | 51.0% | 48.0% |
| 2009 | 35.0% | 44.0% | 43.0% |
| 2008 | 38.0% | 40.0% | 41.0% |
Grade 8 - % of students at or above proficiency
| School | District | State | |
|---|---|---|---|
| CST Algebra I Test | |||
| 2010 | 22.0% | 39.0% | 46.0% |
| 2009 | 4.0% | 60.0% | 44.0% |
| 2008 | 8.0% | 48.0% | 42.0% |
| CST English-Language Arts Test | |||
| 2010 | 67.0% | 61.0% | 54.0% |
| 2009 | 45.0% | 58.0% | 48.0% |
| 2008 | 49.0% | 49.0% | 45.0% |
| CST General Mathematics Test | |||
| 2010 | 14.0% | 18.0% | 30.0% |
| CST History - Social Science Test | |||
| 2010 | 51.0% | 56.0% | 47.0% |
| 2009 | 33.0% | 51.0% | 42.0% |
| 2008 | 28.0% | 43.0% | 36.0% |
| CST Science Test | |||
| 2010 | 60.0% | 67.0% | 59.0% |
| 2009 | 39.0% | 65.0% | 56.0% |
| 2008 | 48.0% | 57.0% | 52.0% |
Grade 9 - % of students at or above proficiency
| School | District | State | |
|---|---|---|---|
| CST Algebra I Test | |||
| 2010 | 6.0% | - | 22.0% |
| CST Biology Test | |||
| 2010 | 71.0% | - | 55.0% |
| 2009 | 38.0% | - | 51.0% |
| 2008 | 26.0% | - | 52.0% |
| CST English-Language Arts Test | |||
| 2010 | 67.0% | - | 54.0% |
| 2009 | 54.0% | - | 50.0% |
| 2008 | 44.0% | - | 49.0% |
| CST General Mathematics Test | |||
| 2010 | 15.0% | - | 17.0% |
| CST Geometry Test | |||
| 2010 | 21.0% | - | 46.0% |
| 2009 | 6.0% | - | 47.0% |
Grade 10 - % of students at or above proficiency
| School | District | State | |
|---|---|---|---|
| CST Chemistry Test | |||
| 2010 | 13.0% | - | 47.0% |
| 2009 | 9.0% | - | 44.0% |
| CST English-Language Arts Test | |||
| 2010 | 43.0% | - | 45.0% |
| 2009 | 42.0% | - | 44.0% |
| 2008 | 31.0% | - | 41.0% |
| CST Science Test | |||
| 2010 | 37.0% | - | 46.0% |
| 2009 | 39.0% | - | 44.0% |
| 2008 | 15.0% | - | 40.0% |
| CST World History Test | |||
| 2010 | 32.0% | - | 42.0% |
| 2009 | 33.0% | - | 38.0% |
| 2008 | 23.0% | - | 33.0% |
| CST Biology Test | |||
| 2008 | 33.0% | - | 35.0% |
Grade 11 - % of students at or above proficiency
| School | District | State | |
|---|---|---|---|
| CST English-Language Arts Test | |||
| 2010 | 35.0% | - | 42.0% |
| 2009 | 36.0% | - | 40.0% |
| 2008 | 37.0% | - | 37.0% |
| CST U.S. History Test | |||
| 2010 | 26.0% | - | 45.0% |
| 2009 | 35.0% | - | 44.0% |
| 2008 | 18.0% | - | 38.0% |
| CST Algebra II Test | |||
| 2009 | 9.0% | - | 12.0% |
End of Course - % of students at or above proficiency
| School | District | State | |
|---|---|---|---|
| CST Algebra I Test | |||
| 2010 | 20.0% | 40.0% | 31.0% |
| 2009 | 6.0% | 60.0% | 28.0% |
| 2008 | 6.0% | 50.0% | 25.0% |
| CST Biology Test | |||
| 2010 | 70.0% | - | 46.0% |
| 2009 | 37.0% | - | 42.0% |
| 2008 | 28.0% | - | 42.0% |
| CST Chemistry Test | |||
| 2010 | 13.0% | - | 38.0% |
| 2009 | 5.0% | - | 36.0% |
| 2008 | 10.0% | - | 32.0% |
| CST General Mathematics Test | |||
| 2010 | 15.0% | 18.0% | 27.0% |
| 2009 | - | - | - |
| 2008 | 5.0% | 36.0% | 27.0% |
| CST Geometry Test | |||
| 2010 | 15.0% | - | 27.0% |
| 2009 | 9.0% | - | 26.0% |
| 2008 | 3.0% | - | 24.0% |
| CST World History Test | |||
| 2010 | 32.0% | - | 41.0% |
| 2009 | 34.0% | - | 38.0% |
| 2008 | 22.0% | - | 33.0% |
| CST Algebra II Test | |||
| 2009 | 4.0% | - | 28.0% |
Source: CA Department of Education 2009-2010
School Map and Similar Schools Nearby
Click to Activate Map of Nearby School Campuses
Private
Public
This School
Similar Schools Nearby
| Temecula Preparatory School KG-12 | 696 Students | 6.2 miles away | ![]() 1 out of 5 | |
| Choice 2000 On-Line School 7-12 | 234 Students | 8.3 miles away | Not Yet Rated | |
| California Military Institute School 7-12 | 542 Students | 9.0 miles away | Not Yet Rated | |
| Nuview Bridge Academy 9-12 | 351 Students | 10.8 miles away | Not Yet Rated | |
| Mercury On-Line Academy of Southern California KG-10 | 77 Students | 11.9 miles away | Not Yet Rated | - |
| Eagles Peak Charter School Inland Empire KG-12 | 3,807 Students | 12.3 miles away | Not Yet Rated | |
| Hemet Academy for Applied Academics and Technology 9-12 | 213 Students | 12.8 miles away | ![]() 5 out of 5 | - |
| San Jacinto Valley Academy KG-12 | 596 Students | 14.3 miles away | ![]() 5 out of 5 | |
| Moreno Valley Community Learning Center School 7-12 | 101 Students | 17.0 miles away | Not Yet Rated | |
| Rainbow Advanced Institute for Learning School KG-12 | 136 Students | 18.2 miles away | Not Yet Rated | |
Compare This School To Nearby Schools ->
School Community Forum

Join a discussion about Santa Rosa Academy and talk to others in the community including students, parents, teachers, and administrators.
Popular Discussion Topics
- Admissions and Registration Questions (e.g. Dress Code and Discipline Policy)
- School Calendar and Upcoming Events (e.g. Graduation)
- After School Programs, Extracurricular Activities, and Athletics (e.g. Football)
- News and Announcements (e.g. Yearbook and Class Supply List Details)
- Graduate and Alumni Events (e.g. Organizing Class Reunions)
Navigation
Can't Find What You Are Looking For?
Rankings
Nearby Cities
Sponsored Links
K-12 Articles
School's out for Recess
Recess used to be the best part of school; that and lunch. But today, a shocking two-thirds of...
Transform Your Middle School Slacker into a Scholar
All children need motivation to learn. Have your child's grades decreased since he started middle...
Strategies to Help Kids Cope with Stress
Many parents believe that kids don't experience stress. Nothing could be further from the truth....


