Vista Murrieta High School

5 out of 5 | 2 Reviews
Find Old Friends From Vista Murrieta High School
Use the form below to search for alumni from Vista Murrieta High School.
School Description
School Summary and Highlights
- Enrolls 3,388 high school students from grades 9-12
- Ranks 305th out of 1,197 high schools in CA.
- 2010 Overall School AYP Met Status: Yes
Additional Contact Information
- Mailing Address: 28251 Clinton Keith Rd., Murrieta, CA 92563
School District Details
- Murrieta Valley Unified School District
- Per-Pupil Spending: $7,725
- Graduation Rate: 79.6%
- Dropout Rate: 2.6%
- Students Per Teacher: 24.5
- Enrolled Students: 22,259
Faculty Details and Student Enrollment
Students and Faculty
- Total Students Enrolled: 3,388
- Total Full Time "Equivalent" Teachers: 132.3
- Average Student-To-Teacher Ratio: 25.6
Students Gender Breakdown
- Males: 1,704 (50.3%)
- Females: 1,684 (49.7%)
Free Lunch Student Eligibility Breakdown
- Eligible for Reduced Lunch: 198 (5.8%)
- Eligible for Free Lunch: 457 (13.5%)
- Eligible for Either Reduced or Free Lunch: 655 (19.3%)
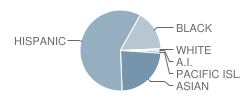
Student Enrollment Distribution by Race / Ethnicity

| Number | Percent | |
|---|---|---|
| American Indian | 7 | 0.2% |
| Black | 301 | 8.9% |
| Asian | 432 | 12.8% |
| Hispanic | 1,085 | 32.0% |
| White | 15 | 0.4% |
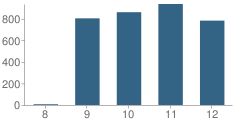
Number of Students Per Grade

| Number | Percent | |
|---|---|---|
| 8th Grade | 7 | 0.2% |
| 9th Grade | 803 | 23.7% |
| 10th Grade | 860 | 25.4% |
| 11th Grade | 936 | 27.6% |
| 12th Grade | 782 | 23.1% |
Graduates Information (2010)
Graduation Rate
School:
93.3%
District:
91.9%
State:
78.6%
Teacher Education Background (2009)
Percent With Ph.D.
School:
61.0%
District:
6.9%
Percent With Master's Degree
School:
41.5%
District:
34.5%
Percent With Bachelor's Degree: 4.9%
Teacher Credentials & Experience (2009)
Percent of Teachers With Emergency Credentials: 1.4%
Percent of Teachers With Credentials: 95.9%
Number of Certificated Staff: 164.0
Average Number of Years of Teacher Experience: 11.1
Average Age
School:
38.8
District:
46.6
Source: CA Department of Education, Source: NCES 2009-2010
Sponsored Links
Test Scores and Performance Information
Overall School Rating
How is this determined?
The overall school rating shows that Vista Murrieta High School performed on average better than many other schools across the state on CST state exams in the following subjects:
- CST Algebra I
- CST Algebra II
- CST Biology
- CST Chemistry
- CST Earth Science
- CST English-Language Arts
- CST General Mathematics
- CST Geometry
- CST Integrated Math 1
- CST Physics
- CST Science
- CST Summative High School Math
- CST U.S. History
- CST World History
AYP Results (2010)
Overall AYP Met: Yes
ELA AYP Met: Yes
Math AYP Met: Yes
ACT Exam Results (2009)
Percent of Students Taking ACT Exam: 19.9%
Average Combined Score: 21.8
Percent Scoring At or Above 21: 61.3%
SAT Exam Results (2009)
Percent of Students Taking SAT Exam: 51.2%
Average Combined Score: 1,455.8
Critical Reading Average: 485.2
Math Average: 495.6
Writing Average: 475.0
Percent Scoring At or Above 1500: 41.7%
CST - Test Proficiency by Grade and Subject
Grade 9 - % of students at or above proficiency
| School | District | State | |
|---|---|---|---|
| CST Algebra I Test | |||
| 2010 | 25.0% | 29.0% | 22.0% |
| 2009 | 53.0% | 44.0% | 21.0% |
| 2008 | 51.0% | 36.0% | 18.0% |
| CST Algebra II Test | |||
| 2010 | 66.0% | 72.0% | 69.0% |
| 2009 | 75.0% | 80.0% | 65.0% |
| 2008 | 84.0% | 86.0% | 66.0% |
| CST Biology Test | |||
| 2010 | 50.0% | 54.0% | 55.0% |
| 2009 | 47.0% | 50.0% | 51.0% |
| 2008 | 51.0% | 51.0% | 52.0% |
| CST English-Language Arts Test | |||
| 2010 | 72.0% | 73.0% | 54.0% |
| 2009 | 69.0% | 68.0% | 50.0% |
| 2008 | 69.0% | 68.0% | 49.0% |
| CST Geometry Test | |||
| 2010 | 73.0% | 67.0% | 46.0% |
| 2009 | 76.0% | 77.0% | 47.0% |
| 2008 | 67.0% | 65.0% | 43.0% |
| CST General Mathematics Test | |||
| 2009 | 24.0% | 22.0% | 17.0% |
| 2008 | 20.0% | 17.0% | 18.0% |
| CST Earth Science Test | |||
| 2008 | 37.0% | 29.0% | 31.0% |
Grade 10 - % of students at or above proficiency
| School | District | State | |
|---|---|---|---|
| CST Algebra I Test | |||
| 2010 | 11.0% | 14.0% | 12.0% |
| 2009 | 18.0% | 15.0% | 11.0% |
| 2008 | 8.0% | 6.0% | 9.0% |
| CST Algebra II Test | |||
| 2010 | 60.0% | 52.0% | 40.0% |
| 2009 | 37.0% | 37.0% | 37.0% |
| 2008 | 36.0% | 35.0% | 36.0% |
| CST Biology Test | |||
| 2010 | 45.0% | 66.0% | 38.0% |
| 2009 | 43.0% | 60.0% | 34.0% |
| 2008 | 24.0% | 58.0% | 35.0% |
| CST Chemistry Test | |||
| 2010 | 56.0% | 54.0% | 47.0% |
| 2009 | 50.0% | 56.0% | 44.0% |
| 2008 | 28.0% | 36.0% | 41.0% |
| CST Earth Science Test | |||
| 2010 | 41.0% | 38.0% | 29.0% |
| 2009 | 36.0% | 31.0% | 23.0% |
| 2008 | 35.0% | 35.0% | 23.0% |
| CST English-Language Arts Test | |||
| 2010 | 67.0% | 63.0% | 45.0% |
| 2009 | 61.0% | 59.0% | 44.0% |
| 2008 | 57.0% | 55.0% | 41.0% |
| CST Geometry Test | |||
| 2010 | 13.0% | 16.0% | 14.0% |
| 2009 | 13.0% | 14.0% | 14.0% |
| 2008 | 11.0% | 11.0% | 12.0% |
| CST Science Test | |||
| 2010 | 58.0% | 62.0% | 46.0% |
| 2009 | 57.0% | 59.0% | 44.0% |
| 2008 | 48.0% | 52.0% | 40.0% |
| CST Summative High School Math Test | |||
| 2010 | 84.0% | 87.0% | 75.0% |
| 2009 | 83.0% | 83.0% | 71.0% |
| 2008 | 63.0% | 64.0% | 68.0% |
| CST World History Test | |||
| 2010 | 63.0% | 60.0% | 42.0% |
| 2009 | 58.0% | 56.0% | 38.0% |
| 2008 | 44.0% | 44.0% | 33.0% |
Grade 11 - % of students at or above proficiency
| School | District | State | |
|---|---|---|---|
| CST Algebra I Test | |||
| 2010 | 3.0% | 15.0% | 8.0% |
| 2009 | 6.0% | 6.0% | 8.0% |
| 2008 | 4.0% | 8.0% | 5.0% |
| CST Algebra II Test | |||
| 2010 | 15.0% | 13.0% | 14.0% |
| 2009 | 6.0% | 8.0% | 12.0% |
| 2008 | 5.0% | 6.0% | 11.0% |
| CST Biology Test | |||
| 2010 | 60.0% | 64.0% | 46.0% |
| 2009 | 49.0% | 57.0% | 41.0% |
| 2008 | 41.0% | 43.0% | 39.0% |
| CST Chemistry Test | |||
| 2010 | 29.0% | 38.0% | 30.0% |
| 2009 | 25.0% | 31.0% | 27.0% |
| 2008 | 24.0% | 22.0% | 25.0% |
| CST Earth Science Test | |||
| 2010 | 38.0% | 37.0% | 32.0% |
| 2009 | 32.0% | 30.0% | 26.0% |
| 2008 | 44.0% | 47.0% | 28.0% |
| CST English-Language Arts Test | |||
| 2010 | 57.0% | 54.0% | 42.0% |
| 2009 | 57.0% | 54.0% | 40.0% |
| 2008 | 50.0% | 46.0% | 37.0% |
| CST Geometry Test | |||
| 2010 | 3.0% | 5.0% | 6.0% |
| 2009 | 4.0% | 4.0% | 7.0% |
| 2008 | 5.0% | 4.0% | 6.0% |
| CST Integrated Math 1 Test | |||
| 2010 | 38.0% | 38.0% | 11.0% |
| CST Physics Test | |||
| 2010 | 73.0% | 80.0% | 53.0% |
| 2009 | 62.0% | 68.0% | 50.0% |
| 2008 | 69.0% | 66.0% | 47.0% |
| CST Summative High School Math Test | |||
| 2010 | 55.0% | 55.0% | 50.0% |
| 2009 | 47.0% | 50.0% | 47.0% |
| 2008 | 37.0% | 37.0% | 43.0% |
| CST U.S. History Test | |||
| 2010 | 51.0% | 49.0% | 45.0% |
| 2009 | 49.0% | 50.0% | 44.0% |
| 2008 | 46.0% | 43.0% | 38.0% |
| CST World History Test | |||
| 2008 | 18.0% | 12.0% | 9.0% |
End of Course - % of students at or above proficiency
| School | District | State | |
|---|---|---|---|
| CST Algebra I Test | |||
| 2010 | 20.0% | 40.0% | 31.0% |
| 2009 | 41.0% | 49.0% | 28.0% |
| 2008 | 36.0% | 43.0% | 25.0% |
| CST Algebra II Test | |||
| 2010 | 39.0% | 38.0% | 31.0% |
| 2009 | 26.0% | 28.0% | 28.0% |
| 2008 | 24.0% | 26.0% | 27.0% |
| CST Biology Test | |||
| 2010 | 53.0% | 58.0% | 46.0% |
| 2009 | 48.0% | 54.0% | 42.0% |
| 2008 | 47.0% | 50.0% | 42.0% |
| CST Chemistry Test | |||
| 2010 | 50.0% | 49.0% | 38.0% |
| 2009 | 44.0% | 48.0% | 36.0% |
| 2008 | 27.0% | 31.0% | 32.0% |
| CST Earth Science Test | |||
| 2010 | 40.0% | 37.0% | 33.0% |
| 2009 | 35.0% | 31.0% | 28.0% |
| 2008 | 37.0% | 37.0% | 28.0% |
| CST Geometry Test | |||
| 2010 | 26.0% | 38.0% | 27.0% |
| 2009 | 29.0% | 38.0% | 26.0% |
| 2008 | 27.0% | 37.0% | 24.0% |
| CST Integrated Math 1 Test | |||
| 2010 | 38.0% | 38.0% | 13.0% |
| CST Physics Test | |||
| 2010 | 72.0% | 79.0% | 49.0% |
| 2009 | 62.0% | 68.0% | 46.0% |
| 2008 | 69.0% | 66.0% | 43.0% |
| CST Summative High School Math Test | |||
| 2010 | 61.0% | 62.0% | 54.0% |
| 2009 | 55.0% | 58.0% | 50.0% |
| 2008 | 41.0% | 43.0% | 47.0% |
| CST World History Test | |||
| 2010 | 63.0% | 59.0% | 41.0% |
| 2009 | 57.0% | 55.0% | 38.0% |
| 2008 | 43.0% | 43.0% | 33.0% |
| CST General Mathematics Test | |||
| 2009 | 24.0% | 42.0% | 26.0% |
| 2008 | 20.0% | 40.0% | 27.0% |
Source: CA Department of Education 2009-2010
School Map and Similar Schools Nearby
Click to Activate Map of Nearby School Campuses
Private
Public
This School
Similar Schools Nearby
| Murrieta Mesa High School 9-12 | 1,112 Students | 2.9 miles away | Not Yet Rated | - |
| Murrieta Valley High School 9-12 | 2,695 Students | 3.9 miles away | ![]() 3.5 out of 5 | |
| Chaparral High School 9-12 | 3,121 Students | 4.4 miles away | Not Yet Rated | |
| Paloma Valley High School 9-12 | 2,717 Students | 4.7 miles away | ![]() 3 out of 5 | |
| Elsinore High School 9-12 | 2,356 Students | 6.4 miles away | ![]() 3 out of 5 | |
| Temecula Valley High School 9-12 | 2,807 Students | 7.4 miles away | ![]() 5 out of 5 | |
| Heritage High School 9-12 | 2,529 Students | 10.2 miles away | ![]() 2 out of 5 | - |
| Great Oak High School 9-12 | 3,296 Students | 11.2 miles away | ![]() 5 out of 5 | |
| Temescal Canyon High School 9-12 | 2,009 Students | 12.3 miles away | Not Yet Rated | |
| West Valley High School 9-12 | 1,896 Students | 12.6 miles away | Not Yet Rated | |
Compare This School To Nearby Schools ->
School Community Forum

Join a discussion about Vista Murrieta High School and talk to others in the community including students, parents, teachers, and administrators.
Popular Discussion Topics
- Admissions and Registration Questions (e.g. Dress Code and Discipline Policy)
- School Calendar and Upcoming Events (e.g. Graduation)
- After School Programs, Extracurricular Activities, and Athletics (e.g. Football)
- News and Announcements (e.g. Yearbook and Class Supply List Details)
- Graduate and Alumni Events (e.g. Organizing Class Reunions)
Navigation
Can't Find What You Are Looking For?
Rankings
Nearby Cities
Sponsored Links
K-12 Articles
Cutting Class
Depression is a very real problem for today's youth. When your spirit doesn't feel good, a lot of...
Halloween Safety Tips
Ghosts and witches sit beside mistletoe and tinsel on store shelves. Orange and black deck the...
Preparing Your Child for the First Day of School
It seems like school was just dismissed for the summer, yet here we are facing another year of back...


(5 / 5) 


