Inderkum High School

No Reviews Yet
Find Old Friends From Inderkum High School
Use the form below to search for alumni from Inderkum High School.
School Description
School Summary and Highlights
- Enrolls 1,666 high school students from grades 9-12
- Ranks 911th out of 1,197 high schools in CA.
- 2010 Overall School AYP Met Status: No
Additional Contact Information
- Mailing Address: 2500 New Market Dr., Sacramento, CA 95835
School District Details
- Natomas Unified School District
- Per-Pupil Spending: $8,014
- Graduation Rate: 81.6%
- Dropout Rate: 5.1%
- Students Per Teacher: 21.4
- Enrolled Students: 12,354
Faculty Details and Student Enrollment
Students and Faculty
- Total Students Enrolled: 1,666
- Total Full Time "Equivalent" Teachers: 66.8
- Average Student-To-Teacher Ratio: 24.9
Students Gender Breakdown
- Males: 883 (53.0%)
- Females: 783 (47.0%)
Free Lunch Student Eligibility Breakdown
- Eligible for Reduced Lunch: 202 (12.1%)
- Eligible for Free Lunch: 671 (40.3%)
- Eligible for Either Reduced or Free Lunch: 873 (52.4%)
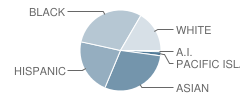
Student Enrollment Distribution by Race / Ethnicity

| Number | Percent | |
|---|---|---|
| American Indian | 12 | 0.7% |
| Black | 484 | 29.1% |
| Asian | 472 | 28.3% |
| Hispanic | 359 | 21.5% |
| White | 270 | 16.2% |
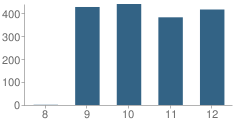
Number of Students Per Grade

| Number | Percent | |
|---|---|---|
| 8th Grade | 1 | 0.06% |
| 9th Grade | 427 | 25.6% |
| 10th Grade | 440 | 26.4% |
| 11th Grade | 382 | 22.9% |
| 12th Grade | 416 | 25.0% |
Graduates Information (2010)
Graduation Rate
School:
85.8%
District:
81.5%
State:
78.6%
Teacher Education Background (2009)
Percent With Ph.D.
School:
1.3%
District:
6.7%
Percent With Master's Degree
School:
17.5%
District:
43.3%
Percent With Bachelor's Degree
School:
16.3%
District:
10.0%
Teacher Credentials & Experience (2009)
Percent of Teachers With Credentials: 92.9%
Number of Certificated Staff: 80.0
Average Number of Years of Teacher Experience: 8.9
Average Age
School:
38.4
District:
46.9
Source: CA Department of Education, Source: NCES 2009-2010
School Ratings and Reviews
Be The First To Review Inderkum High School!
Sponsored Links
Test Scores and Performance Information
Overall School Rating
How is this determined?
The overall school rating shows that Inderkum High School performed on average worse than many other schools across the state on CST state exams in the following subjects:
- CST Algebra I
- CST Algebra II
- CST Biology
- CST Chemistry
- CST Earth Science
- CST English-Language Arts
- CST General Mathematics
- CST Geometry
- CST Physics
- CST Science
- CST Summative High School Math
- CST U.S. History
- CST World History
AYP Results (2010)
Overall AYP Met: No
ELA AYP Met: No
Math AYP Met: No
ACT Exam Results (2009)
Percent of Students Taking ACT Exam: 8.2%
Average Combined Score: 19.8
Percent Scoring At or Above 21: 36.7%
SAT Exam Results (2009)
Percent of Students Taking SAT Exam: 33.1%
Average Combined Score: 1,425.5
Critical Reading Average: 474.6
Math Average: 493.8
Writing Average: 457.0
Percent Scoring At or Above 1500: 36.4%
CST - Test Proficiency by Grade and Subject
Grade 9 - % of students at or above proficiency
| School | District | State | |
|---|---|---|---|
| CST Algebra I Test | |||
| 2010 | 9.0% | 13.0% | 22.0% |
| 2009 | 5.0% | 10.0% | 21.0% |
| 2008 | 11.0% | 9.0% | 18.0% |
| CST Algebra II Test | |||
| 2010 | 45.0% | 27.0% | 69.0% |
| 2009 | 34.0% | 32.0% | 65.0% |
| CST Biology Test | |||
| 2010 | 62.0% | 54.0% | 55.0% |
| 2009 | 56.0% | 48.0% | 51.0% |
| 2008 | 54.0% | 47.0% | 52.0% |
| CST Earth Science Test | |||
| 2010 | 29.0% | 39.0% | 35.0% |
| 2009 | 21.0% | 24.0% | 29.0% |
| 2008 | 30.0% | 28.0% | 31.0% |
| CST English-Language Arts Test | |||
| 2010 | 47.0% | 57.0% | 54.0% |
| 2009 | 50.0% | 48.0% | 50.0% |
| 2008 | 46.0% | 47.0% | 49.0% |
| CST Geometry Test | |||
| 2010 | 27.0% | 29.0% | 46.0% |
| 2009 | 21.0% | 25.0% | 47.0% |
| 2008 | 17.0% | 24.0% | 43.0% |
| CST General Mathematics Test | |||
| 2009 | 11.0% | 9.0% | 17.0% |
| 2008 | 18.0% | 12.0% | 18.0% |
Grade 10 - % of students at or above proficiency
| School | District | State | |
|---|---|---|---|
| CST Algebra I Test | |||
| 2010 | 3.0% | 4.0% | 12.0% |
| 2009 | 10.0% | 4.0% | 11.0% |
| 2008 | 8.0% | 4.0% | 9.0% |
| CST Algebra II Test | |||
| 2010 | 23.0% | 16.0% | 40.0% |
| 2009 | 10.0% | 13.0% | 37.0% |
| 2008 | 22.0% | 23.0% | 36.0% |
| CST Biology Test | |||
| 2010 | 31.0% | 37.0% | 38.0% |
| 2009 | 45.0% | 37.0% | 34.0% |
| 2008 | 29.0% | 33.0% | 35.0% |
| CST Chemistry Test | |||
| 2010 | 51.0% | 40.0% | 47.0% |
| 2009 | 54.0% | 24.0% | 44.0% |
| 2008 | 33.0% | 24.0% | 41.0% |
| CST Earth Science Test | |||
| 2010 | 10.0% | 12.0% | 29.0% |
| 2009 | 14.0% | 13.0% | 23.0% |
| 2008 | 25.0% | 25.0% | 23.0% |
| CST English-Language Arts Test | |||
| 2010 | 38.0% | 44.0% | 45.0% |
| 2009 | 32.0% | 36.0% | 44.0% |
| 2008 | 40.0% | 39.0% | 41.0% |
| CST Geometry Test | |||
| 2010 | 7.0% | 8.0% | 14.0% |
| 2009 | 8.0% | 6.0% | 14.0% |
| 2008 | 4.0% | 7.0% | 12.0% |
| CST Science Test | |||
| 2010 | 37.0% | 40.0% | 46.0% |
| 2009 | 35.0% | 37.0% | 44.0% |
| 2008 | 35.0% | 34.0% | 40.0% |
| CST Summative High School Math Test | |||
| 2010 | 36.0% | 31.0% | 75.0% |
| CST World History Test | |||
| 2010 | 23.0% | 35.0% | 42.0% |
| 2009 | 24.0% | 29.0% | 38.0% |
| 2008 | 20.0% | 25.0% | 33.0% |
Grade 11 - % of students at or above proficiency
| School | District | State | |
|---|---|---|---|
| CST Algebra I Test | |||
| 2010 | 3.0% | 4.0% | 8.0% |
| 2009 | 8.0% | 5.0% | 8.0% |
| 2008 | 4.0% | 3.0% | 5.0% |
| CST Algebra II Test | |||
| 2010 | 6.0% | 4.0% | 14.0% |
| 2009 | 9.0% | 6.0% | 12.0% |
| 2008 | 12.0% | 7.0% | 11.0% |
| CST Biology Test | |||
| 2010 | 28.0% | 31.0% | 46.0% |
| 2009 | 43.0% | 33.0% | 41.0% |
| 2008 | 39.0% | 34.0% | 39.0% |
| CST Chemistry Test | |||
| 2010 | 32.0% | 25.0% | 30.0% |
| 2009 | 37.0% | 23.0% | 27.0% |
| 2008 | 28.0% | 22.0% | 25.0% |
| CST Earth Science Test | |||
| 2010 | 14.0% | 32.0% | 32.0% |
| 2009 | 9.0% | 8.0% | 26.0% |
| 2008 | 24.0% | 17.0% | 28.0% |
| CST English-Language Arts Test | |||
| 2010 | 31.0% | 36.0% | 42.0% |
| 2009 | 37.0% | 34.0% | 40.0% |
| 2008 | 33.0% | 34.0% | 37.0% |
| CST Geometry Test | |||
| 2010 | 9.0% | 5.0% | 6.0% |
| 2009 | 7.0% | 4.0% | 7.0% |
| 2008 | 7.0% | 8.0% | 6.0% |
| CST Physics Test | |||
| 2010 | 24.0% | 26.0% | 53.0% |
| 2009 | 30.0% | 23.0% | 50.0% |
| 2008 | 34.0% | 19.0% | 47.0% |
| CST Summative High School Math Test | |||
| 2010 | 30.0% | 22.0% | 50.0% |
| 2009 | 35.0% | 24.0% | 47.0% |
| 2008 | 37.0% | 27.0% | 43.0% |
| CST U.S. History Test | |||
| 2010 | 29.0% | 36.0% | 45.0% |
| 2009 | 32.0% | 34.0% | 44.0% |
| 2008 | 25.0% | 33.0% | 38.0% |
| CST World History Test | |||
| 2008 | 4.0% | 8.0% | 9.0% |
End of Course - % of students at or above proficiency
| School | District | State | |
|---|---|---|---|
| CST Algebra I Test | |||
| 2010 | 6.0% | 22.0% | 31.0% |
| 2009 | 7.0% | 21.0% | 28.0% |
| 2008 | 9.0% | 16.0% | 25.0% |
| CST Algebra II Test | |||
| 2010 | 17.0% | 12.0% | 31.0% |
| 2009 | 12.0% | 10.0% | 28.0% |
| 2008 | 18.0% | 18.0% | 27.0% |
| CST Biology Test | |||
| 2010 | 40.0% | 43.0% | 46.0% |
| 2009 | 48.0% | 40.0% | 42.0% |
| 2008 | 35.0% | 38.0% | 42.0% |
| CST Chemistry Test | |||
| 2010 | 42.0% | 32.0% | 38.0% |
| 2009 | 42.0% | 23.0% | 36.0% |
| 2008 | 30.0% | 23.0% | 32.0% |
| CST Earth Science Test | |||
| 2010 | 25.0% | 36.0% | 33.0% |
| 2009 | 17.0% | 21.0% | 28.0% |
| 2008 | 29.0% | 25.0% | 28.0% |
| CST Geometry Test | |||
| 2010 | 14.0% | 17.0% | 27.0% |
| 2009 | 13.0% | 16.0% | 26.0% |
| 2008 | 9.0% | 14.0% | 24.0% |
| CST Physics Test | |||
| 2010 | 23.0% | 25.0% | 49.0% |
| 2009 | 30.0% | 23.0% | 46.0% |
| 2008 | 30.0% | 19.0% | 43.0% |
| CST Summative High School Math Test | |||
| 2010 | 31.0% | 25.0% | 54.0% |
| 2009 | 37.0% | 26.0% | 50.0% |
| 2008 | 36.0% | 28.0% | 47.0% |
| CST World History Test | |||
| 2010 | 23.0% | 34.0% | 41.0% |
| 2009 | 23.0% | 28.0% | 38.0% |
| 2008 | 19.0% | 24.0% | 33.0% |
| CST General Mathematics Test | |||
| 2009 | 11.0% | 18.0% | 26.0% |
| 2008 | 18.0% | 12.0% | 27.0% |
Source: CA Department of Education 2009-2010
School Map and Similar Schools Nearby
Click to Activate Map of Nearby School Campuses
Private
Public
This School
Similar Schools Nearby
| Natomas High School 9-12 | 1,456 Students | 2.4 miles away | Not Yet Rated | |
| Rio Tierra Junior High School 7-9 | 456 Students | 3.1 miles away | Not Yet Rated | |
| Norwood Junior High School 7-8 | 598 Students | 3.2 miles away | Not Yet Rated | - |
| Rio Linda Junior High School 7-8 | 543 Students | 4.3 miles away | Not Yet Rated | |
| Rio Linda High School 9-12 | 2,007 Students | 4.4 miles away | Not Yet Rated | |
| Grant Union High School 9-12 | 1,927 Students | 4.7 miles away | Not Yet Rated | |
| Health Professions High School 9-12 | 475 Students | 6.8 miles away | Not Yet Rated | |
| Valley Oaks School KG-12 | 11 Students | 7.4 miles away | Not Yet Rated | - |
| Encina High School 9-12 | 639 Students | 7.4 miles away | ![]() 3 out of 5 | |
| C. K. Mcclatchy High School 9-12 | 2,198 Students | 7.8 miles away | Not Yet Rated | |
Compare This School To Nearby Schools ->
School Community Forum

Join a discussion about Inderkum High School and talk to others in the community including students, parents, teachers, and administrators.
Popular Discussion Topics
- Admissions and Registration Questions (e.g. Dress Code and Discipline Policy)
- School Calendar and Upcoming Events (e.g. Graduation)
- After School Programs, Extracurricular Activities, and Athletics (e.g. Football)
- News and Announcements (e.g. Yearbook and Class Supply List Details)
- Graduate and Alumni Events (e.g. Organizing Class Reunions)
Navigation
Can't Find What You Are Looking For?
Rankings
Nearby Cities
Sponsored Links
K-12 Articles
Halloween Safety Tips
Ghosts and witches sit beside mistletoe and tinsel on store shelves. Orange and black deck the...
It's the Most Wonderful Time of the Year!
For most of the country, school is starting up this week or later this month-at the beginning of...
Help Your Child Achieve Success in Middle School
Middle school is for children between the ages of 10 and 14 years. At this time children begin to...

