Six Rivers Charter High School
Rating
Not Available
Not Available

3 out of 5 | 2 Reviews
Find Old Friends From Six Rivers Charter High School
Use the form below to search for alumni from Six Rivers Charter High School.
School Description
School Summary and Highlights
- Enrolls 87 high school students from grades 9-12
- Ranks 168th out of 1,197 high schools in CA.
- 2010 Overall School AYP Met Status: Yes
Additional Contact Information
- Mailing Address: 1720 M St., Arcata, CA 95521
School Operational Details
- Charter School
School District Details
- Northern Humboldt Union High School District
- Per-Pupil Spending: $9,775
- Dropout Rate: 2.6%
- Students Per Teacher: 16.1
- Enrolled Students: 1,679
Faculty Details and Student Enrollment
Students and Faculty
- Total Students Enrolled: 87
- Total Full Time "Equivalent" Teachers: 6.0
- Average Student-To-Teacher Ratio: 14.5
Students Gender Breakdown
- Males: 34 (39.1%)
- Females: 53 (60.9%)
Free Lunch Student Eligibility Breakdown
- Eligible for Reduced Lunch: - (-)
- Eligible for Free Lunch: 36 (41.4%)
- Eligible for Either Reduced or Free Lunch: 36 (41.4%)
Student Enrollment Distribution by Race / Ethnicity
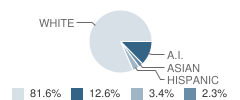
| Number | Percent | |
|---|---|---|
| American Indian | 11 | 12.6% |
| Black | - | - |
| Asian | 2 | 2.3% |
| Hispanic | 3 | 3.4% |
| White | 71 | 81.6% |
Number of Students Per Grade
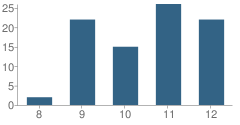
| Number | Percent | |
|---|---|---|
| 8th Grade | 2 | 2.3% |
| 9th Grade | 22 | 25.3% |
| 10th Grade | 15 | 17.2% |
| 11th Grade | 26 | 29.9% |
| 12th Grade | 22 | 25.3% |
Teacher Education Background (2009)
Percent With Ph.D.
School:
12.5%
District:
100.0%
Teacher Credentials & Experience (2009)
Percent of Teachers With Credentials: 100.0%
Number of Certificated Staff: 8.0
Average Number of Years of Teacher Experience: 4.1
Average Age
School:
33.8
District:
51.0
Source: CA Department of Education, Source: NCES 2009-2010
School Ratings and Reviews
Overall Rating: 3

3 out of 5 | 2 Reviews
The Overall Rating is the school's average rating from parents, students, school faculty and staff. The highest rating is five apples and the lowest is one apple.
Share Your Review About This School
2 reviews for Six Rivers Charter High School
- Reviewed by Parent/Guardian on August 31, 2010
- Rating:
 (5 / 5) Flag as inappropriate
- Reviewed by Parent/Guardian on April 18, 2008
- Rating:
 (1 / 5) Flag as inappropriate
 - The administration has demonstrated an inadequate approach towards special needs students. The approach is to eliminate or decrease students with less than average or better performance rather than assist and enhance their educational experience.
School Map and Similar Schools Nearby
Click to Activate Map of Nearby School Campuses
Private
Public
This School
Similar Schools Nearby
| Northcoast Preparatory and Performing Arts Academy 9-12 | 91 Students | 1.0 miles away | Not Yet Rated | - |
| Pacific View Charter School KG-12 | 188 Students | 6.7 miles away | Not Yet Rated | |
| Alder Grove Charter School KG-12 | 231 Students | 8.7 miles away | Not Yet Rated | |
Compare This School To Nearby Schools ->
Navigation
Can't Find What You Are Looking For?
Rankings
Nearby Cities
Sponsored Links
K-12 Articles

The Very Best Things in the World
A recent poll in the U.K. revealed that children view the "very best thing in the world" as being...
A recent poll in the U.K. revealed that children view the "very best thing in the world" as being...

Is Your Child's Teacher a Bully?
We've all heard about kids being bullied by peers. Kids taunt, tease, pull hair, shove and push...
We've all heard about kids being bullied by peers. Kids taunt, tease, pull hair, shove and push...

Idle Hands
The worst affliction affecting our kids today is not teen pregnancy, drugs and alcohol, or...
The worst affliction affecting our kids today is not teen pregnancy, drugs and alcohol, or...