Oakland Military Institute, College Preparatory Academy

5 out of 5 | 1 Review
Find Old Friends From Oakland Military Institute, College Preparatory Academy
Use the form below to search for alumni from Oakland Military Institute, College Preparatory Academy.
School Description
School Summary and Highlights
- Enrolls 608 middle and high school students from grades 6-12
- Ranks 752nd out of 1,197 high schools in CA.
- 2010 Overall School AYP Met Status: No
- National Blue Ribbon Schools Award 2008

Additional Contact Information
- Mailing Address: 3877 Lusk St., Oakland, CA 94608
School Operational Details
- Title I EligibleAll students of this school are eligible for participation in authorized programs.
- Charter School
School District Details
- Oakland Unified School District
- Per-Pupil Spending: $10,036
- Graduation Rate: 50.3%
- Dropout Rate: 7.8%
- Students Per Teacher: 18.7
- Enrolled Students: 39,304
Faculty Details and Student Enrollment
Students and Faculty
- Total Students Enrolled: 608
- Total Full Time "Equivalent" Teachers: 32.3
- Average Student-To-Teacher Ratio: 18.9
Students Gender Breakdown
- Males: 366 (60.2%)
- Females: 242 (39.8%)
Free Lunch Student Eligibility Breakdown
- Eligible for Reduced Lunch: 95 (15.6%)
- Eligible for Free Lunch: 393 (64.6%)
- Eligible for Either Reduced or Free Lunch: 488 (80.3%)
Student Enrollment Distribution by Race / Ethnicity
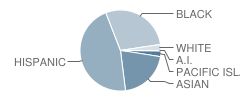
| Number | Percent | |
|---|---|---|
| American Indian | 2 | 0.3% |
| Black | 173 | 28.5% |
| Asian | 125 | 20.6% |
| Hispanic | 279 | 45.9% |
| White | 15 | 2.5% |
Number of Students Per Grade

| Number | Percent | |
|---|---|---|
| 6th Grade | 92 | 15.1% |
| 7th Grade | 101 | 16.6% |
| 8th Grade | 103 | 16.9% |
| 9th Grade | 108 | 17.8% |
| 10th Grade | 95 | 15.6% |
| 11th Grade | 52 | 8.6% |
| 12th Grade | 57 | 9.4% |
Teacher Education Background (2009)
Percent With Ph.D.
School:
2.9%
District:
1.0%
Percent With Master's Degree
School:
23.5%
District:
14.7%
Percent With Bachelor's Degree
School:
11.8%
District:
39.0%
Teacher Credentials & Experience (2009)
Percent of Teachers With Emergency Credentials: 12.5%
Percent of Teachers With Credentials: 78.1%
Number of Certificated Staff: 34.0
Average Number of Years of Teacher Experience: 7.3
Average Age
School:
39.7
District:
48.3
Source: CA Department of Education, Source: NCES 2009-2010
Sponsored Links
Test Scores and Performance Information
Overall School Rating
How is this determined?
The overall school rating shows that Oakland Military Institute, College Preparatory Academy performed on average worse than many other schools across the state on CST state exams in the following subjects:
- CST Algebra I
- CST Algebra II
- CST Biology
- CST Chemistry
- CST English-Language Arts
- CST General Mathematics
- CST Geometry
- CST History - Social Science
- CST Mathematics
- CST Physics
- CST Science
- CST Summative High School Math
- CST U.S. History
- CST World History
AYP Results (2010)
Overall AYP Met: No
ELA AYP Met: No
Math AYP Met: Yes
Program Improvement (PI) Requirement Under NCLB (2010)
First Year PI Requirement was Implemented: 2010-2011
School's Placement Under NCLB: Year 1
ACT Exam Results (2009)
Percent of Students Taking ACT Exam: 9.5%
SAT Exam Results (2009)
Percent of Students Taking SAT Exam: 88.1%
Average Combined Score: 1,229.2
Critical Reading Average: 409.2
Math Average: 424.1
Writing Average: 396.0
Percent Scoring At or Above 1500: 18.9%
CST - Test Proficiency by Grade and Subject
Grade 6 - % of students at or above proficiency
| School | District | State | |
|---|---|---|---|
| CST English-Language Arts Test | |||
| 2010 | 34.0% | 39.0% | 55.0% |
| 2009 | 34.0% | 33.0% | 52.0% |
| 2008 | 31.0% | 27.0% | 47.0% |
| CST Mathematics Test | |||
| 2010 | 27.0% | 38.0% | 52.0% |
| 2009 | 23.0% | 34.0% | 49.0% |
| 2008 | 29.0% | 27.0% | 44.0% |
Grade 7 - % of students at or above proficiency
| School | District | State | |
|---|---|---|---|
| CST English-Language Arts Test | |||
| 2010 | 45.0% | 38.0% | 55.0% |
| 2009 | 44.0% | 38.0% | 54.0% |
| 2008 | 45.0% | 30.0% | 49.0% |
| CST Mathematics Test | |||
| 2010 | 34.0% | 41.0% | 48.0% |
| 2009 | 31.0% | 31.0% | 43.0% |
| 2008 | 36.0% | 25.0% | 41.0% |
| CST Algebra I Test | |||
| 2008 | 82.0% | 58.0% | 80.0% |
Grade 8 - % of students at or above proficiency
| School | District | State | |
|---|---|---|---|
| CST Algebra I Test | |||
| 2010 | 47.0% | 23.0% | 46.0% |
| 2009 | 37.0% | 24.0% | 44.0% |
| 2008 | 14.0% | 21.0% | 42.0% |
| CST English-Language Arts Test | |||
| 2010 | 39.0% | 36.0% | 54.0% |
| 2009 | 39.0% | 29.0% | 48.0% |
| 2008 | 28.0% | 28.0% | 45.0% |
| CST General Mathematics Test | |||
| 2010 | 27.0% | 3.0% | 30.0% |
| 2009 | 15.0% | 14.0% | 30.0% |
| 2008 | 42.0% | 7.0% | 31.0% |
| CST History - Social Science Test | |||
| 2010 | 52.0% | 31.0% | 47.0% |
| 2009 | 41.0% | 27.0% | 42.0% |
| 2008 | 20.0% | 23.0% | 36.0% |
| CST Science Test | |||
| 2010 | 67.0% | 46.0% | 59.0% |
| 2009 | 65.0% | 36.0% | 56.0% |
| 2008 | 60.0% | 36.0% | 52.0% |
Grade 9 - % of students at or above proficiency
| School | District | State | |
|---|---|---|---|
| CST Algebra I Test | |||
| 2010 | 16.0% | 10.0% | 22.0% |
| 2009 | 7.0% | 6.0% | 21.0% |
| CST English-Language Arts Test | |||
| 2010 | 55.0% | 34.0% | 54.0% |
| 2009 | 52.0% | 28.0% | 50.0% |
| 2008 | 38.0% | 27.0% | 49.0% |
| CST Geometry Test | |||
| 2010 | 19.0% | 24.0% | 46.0% |
| 2009 | 14.0% | 16.0% | 47.0% |
| 2008 | 9.0% | 22.0% | 43.0% |
Grade 10 - % of students at or above proficiency
| School | District | State | |
|---|---|---|---|
| CST Algebra II Test | |||
| 2010 | 29.0% | 18.0% | 40.0% |
| 2009 | - | - | - |
| 2008 | 14.0% | 15.0% | 36.0% |
| CST Biology Test | |||
| 2010 | 33.0% | 24.0% | 38.0% |
| 2009 | 12.0% | 20.0% | 34.0% |
| 2008 | 54.0% | 18.0% | 35.0% |
| CST English-Language Arts Test | |||
| 2010 | 53.0% | 25.0% | 45.0% |
| 2009 | 48.0% | 24.0% | 44.0% |
| 2008 | 45.0% | 22.0% | 41.0% |
| CST Geometry Test | |||
| 2010 | 6.0% | 2.0% | 14.0% |
| 2009 | - | - | - |
| 2008 | 6.0% | 3.0% | 12.0% |
| CST Science Test | |||
| 2010 | 45.0% | 30.0% | 46.0% |
| 2009 | 25.0% | 29.0% | 44.0% |
| 2008 | 37.0% | 21.0% | 40.0% |
| CST World History Test | |||
| 2010 | 21.0% | 19.0% | 42.0% |
| 2009 | 17.0% | 20.0% | 38.0% |
| 2008 | 22.0% | 14.0% | 33.0% |
| CST Algebra I Test | |||
| 2009 | 9.0% | 1.0% | 11.0% |
| 2008 | 5.0% | 2.0% | 9.0% |
| CST Chemistry Test | |||
| 2008 | 3.0% | 16.0% | 41.0% |
Grade 11 - % of students at or above proficiency
| School | District | State | |
|---|---|---|---|
| CST English-Language Arts Test | |||
| 2010 | 33.0% | 26.0% | 42.0% |
| 2009 | 40.0% | 22.0% | 40.0% |
| 2008 | 28.0% | 21.0% | 37.0% |
| CST Geometry Test | |||
| 2010 | 5.0% | 1.0% | 6.0% |
| CST U.S. History Test | |||
| 2010 | 31.0% | 27.0% | 45.0% |
| 2009 | 36.0% | 25.0% | 44.0% |
| 2008 | 18.0% | 20.0% | 38.0% |
| CST Biology Test | |||
| 2009 | 8.0% | 18.0% | 41.0% |
| 2008 | 21.0% | 19.0% | 39.0% |
| CST Physics Test | |||
| 2009 | 45.0% | 23.0% | 50.0% |
| CST Summative High School Math Test | |||
| 2009 | 20.0% | 29.0% | 47.0% |
| CST Algebra II Test | |||
| 2008 | 6.0% | 3.0% | 11.0% |
End of Course - % of students at or above proficiency
| School | District | State | |
|---|---|---|---|
| CST Algebra I Test | |||
| 2010 | 33.0% | 19.0% | 31.0% |
| 2009 | 17.0% | 17.0% | 28.0% |
| 2008 | 13.0% | 13.0% | 25.0% |
| CST Algebra II Test | |||
| 2010 | 25.0% | 14.0% | 31.0% |
| 2009 | 9.0% | 14.0% | 28.0% |
| 2008 | 13.0% | 11.0% | 27.0% |
| CST Biology Test | |||
| 2010 | 33.0% | 25.0% | 46.0% |
| 2009 | 11.0% | 21.0% | 42.0% |
| 2008 | 36.0% | 19.0% | 42.0% |
| CST Chemistry Test | |||
| 2010 | 2.0% | 15.0% | 38.0% |
| 2009 | - | - | - |
| 2008 | 3.0% | 13.0% | 32.0% |
| CST General Mathematics Test | |||
| 2010 | 27.0% | 3.0% | 27.0% |
| 2009 | 15.0% | 12.0% | 26.0% |
| 2008 | 37.0% | 7.0% | 27.0% |
| CST Geometry Test | |||
| 2010 | 11.0% | 14.0% | 27.0% |
| 2009 | 14.0% | 11.0% | 26.0% |
| 2008 | 11.0% | 13.0% | 24.0% |
| CST World History Test | |||
| 2010 | 21.0% | 17.0% | 41.0% |
| 2009 | 15.0% | 17.0% | 38.0% |
| 2008 | 22.0% | 11.0% | 33.0% |
| CST Physics Test | |||
| 2009 | 45.0% | 11.0% | 46.0% |
| CST Summative High School Math Test | |||
| 2009 | 23.0% | 34.0% | 50.0% |
| 2008 | 63.0% | 37.0% | 47.0% |
Source: CA Department of Education 2009-2010
School Map and Similar Schools Nearby
Click to Activate Map of Nearby School Campuses
Private
Public
This School
Similar Schools Nearby
| Bay Area Technology School 6-12 | 181 Students | 0.7 miles away | Not Yet Rated | |
| Oakland School for the Arts 1-12 | 503 Students | 1.5 miles away | Not Yet Rated | |
| Lighthouse Community Charter High School 9-12 | 191 Students | 1.6 miles away | ![]() 5 out of 5 | |
| Arts and Technology High School of Oakland 9-12 | 248 Students | 1.7 miles away | Not Yet Rated | |
| Oakland Charter High School 9-12 | 92 Students | 2.1 miles away | Not Yet Rated | - |
| Civicorps Corpsmember Academy 9-12 | 104 Students | 2.2 miles away | Not Yet Rated | - |
| Aspire California College Preparatory Academy 7-12 | 196 Students | 2.8 miles away | Not Yet Rated | - |
| Bay Area School of Enterprise 9-12 | 116 Students | 3.6 miles away | Not Yet Rated | |
| Nea Community Learning Center School KG-12 | 288 Students | 3.7 miles away | Not Yet Rated | - |
| Alameda Community Learning Center School 6-12 | 249 Students | 4.0 miles away | ![]() 5 out of 5 | |
Compare This School To Nearby Schools ->
School Community Forum

Join a discussion about Oakland Military Institute, College Preparatory Academy and talk to others in the community including students, parents, teachers, and administrators.
Popular Discussion Topics
- Admissions and Registration Questions (e.g. Dress Code and Discipline Policy)
- School Calendar and Upcoming Events (e.g. Graduation)
- After School Programs, Extracurricular Activities, and Athletics (e.g. Football)
- News and Announcements (e.g. Yearbook and Class Supply List Details)
- Graduate and Alumni Events (e.g. Organizing Class Reunions)
Navigation
Can't Find What You Are Looking For?
Rankings
Nearby Cities
Sponsored Links
K-12 Articles
Does Your Child's Teacher Make a Difference
School improvement is always in the news. Teachers demand smaller class sizes. The government calls...
Promoting Childhood Literacy
The number of American adults who are illiterate is astounding. People who lack the ability to read...
Siblings and Individual Identity in High School
When the first day of high school looms in the near future, teens are both excited and anxious....


(5 / 5) 