Stanford New School
Rating
Not Available
Not Available

No Reviews Yet
Find Old Friends From Stanford New School
Use the form below to search for alumni from Stanford New School.
School Description
School Summary and Highlights
- Enrolls 554 elementary, middle, and high school students from grades KG-12
- Ranks 1150th out of 1,197 high schools in CA.
- 2010 Overall School AYP Met Status: No
Additional Contact Information
- Mailing Address: 475 Pope St., Menlo Park, CA 94025
School Operational Details
- Title I Eligible
- Charter School
School District Details
- Ravenswood City Elementary School District
- Per-Pupil Spending: $8,181
- Dropout Rate: 3.0%
- Students Per Teacher: 16.9
- Enrolled Students: 4,381
Faculty Details and Student Enrollment
Students and Faculty
- Total Students Enrolled: 554
- Total Full Time "Equivalent" Teachers: 37.8
- Average Student-To-Teacher Ratio: 14.7
Students Gender Breakdown
- Males: 263 (47.5%)
- Females: 291 (52.5%)
Free Lunch Student Eligibility Breakdown
- Eligible for Reduced Lunch: 23 (4.2%)
- Eligible for Free Lunch: 486 (87.7%)
- Eligible for Either Reduced or Free Lunch: 509 (91.9%)
Student Enrollment Distribution by Race / Ethnicity
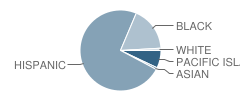
| Number | Percent | |
|---|---|---|
| American Indian | - | - |
| Black | 98 | 17.7% |
| Asian | 4 | 0.7% |
| Hispanic | 407 | 73.5% |
| White | 5 | 0.9% |
Number of Students Per Grade
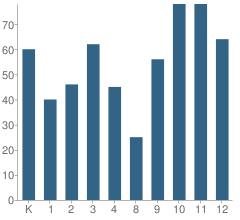
| Number | Percent | |
|---|---|---|
| Kindergarten | 60 | 10.8% |
| 1st Grade | 40 | 7.2% |
| 2nd Grade | 46 | 8.3% |
| 3rd Grade | 62 | 11.2% |
| 4th Grade | 45 | 8.1% |
| 8th Grade | 25 | 4.5% |
| 9th Grade | 56 | 10.1% |
| 10th Grade | 78 | 14.1% |
| 11th Grade | 78 | 14.1% |
| 12th Grade | 64 | 11.6% |
Graduates Information (2010)
Graduation Rate
School:
93.4%
State:
78.6%
Teacher Education Background (2009)
Percent With Master's Degree
School:
22.0%
District:
42.5%
Percent With Bachelor's Degree
School:
19.5%
District:
7.5%
Teacher Credentials & Experience (2009)
Percent of Teachers With Credentials: 91.9%
Number of Certificated Staff: 41.0
Average Number of Years of Teacher Experience: 6.1
Average Age
School:
80.7
District:
44.3
Source: CA Department of Education, Source: NCES 2009-2010
School Ratings and Reviews
Be The First To Review Stanford New School!
School Map and Similar Schools Nearby
Click to Activate Map of Nearby School Campuses
Private
Public
This School
Similar Schools Nearby
| Aspire East Palo Alto Phoenix Academy 9-12 | 79 Students | 1.5 miles away | Not Yet Rated | - |
| Summit Preparatory Charter High School 9-12 | 410 Students | 3.5 miles away | Not Yet Rated | - |
| Everest Public High School 9-12 | 104 Students | 4.5 miles away | Not Yet Rated | - |
| Fame Public Charter School KG-12 | 1,439 Students | 9.9 miles away |  5 out of 5 | |
Compare This School To Nearby Schools ->
School Community Forum

Join a discussion about Stanford New School and talk to others in the community including students, parents, teachers, and administrators.
Popular Discussion Topics
- Admissions and Registration Questions (e.g. Dress Code and Discipline Policy)
- School Calendar and Upcoming Events (e.g. Graduation)
- After School Programs, Extracurricular Activities, and Athletics (e.g. Football)
- News and Announcements (e.g. Yearbook and Class Supply List Details)
- Graduate and Alumni Events (e.g. Organizing Class Reunions)
Navigation
Can't Find What You Are Looking For?
Rankings
Nearby Cities
Sponsored Links
K-12 Articles

Helping Your Learning Disabled Child
Thousands of children in America struggle to learn on a daily basis. Many of them have invisible...
Thousands of children in America struggle to learn on a daily basis. Many of them have invisible...

Summer Advice
A few weeks ago, at the weekly after-school program I run through my local church, a group of...
A few weeks ago, at the weekly after-school program I run through my local church, a group of...

School's out for Recess
Recess used to be the best part of school; that and lunch. But today, a shocking two-thirds of...
Recess used to be the best part of school; that and lunch. But today, a shocking two-thirds of...