Health Professions High School
Rating
Not Available
Not Available

No Reviews Yet
Find Old Friends From Health Professions High School
Use the form below to search for alumni from Health Professions High School.
School Description
School Summary and Highlights
- Enrolls 475 high school students from grades 9-12
- Ranks 947th out of 1,197 high schools in CA.
- 2010 Overall School AYP Met Status: Yes
School Operational Details
- Title I Eligible
School District Details
- Sacramento City Unified School District
- Per-Pupil Spending: $10,051
- Graduation Rate: 57.9%
- Dropout Rate: 3.7%
- Students Per Teacher: 21.2
- Enrolled Students: 47,532
Faculty Details and Student Enrollment
Students and Faculty
- Total Students Enrolled: 475
- Total Full Time "Equivalent" Teachers: 20.0
- Average Student-To-Teacher Ratio: 23.8
Students Gender Breakdown
- Males: 133 (28.0%)
- Females: 342 (72.0%)
Free Lunch Student Eligibility Breakdown
- Eligible for Reduced Lunch: 46 (9.7%)
- Eligible for Free Lunch: 278 (58.5%)
- Eligible for Either Reduced or Free Lunch: 324 (68.2%)
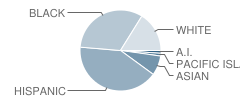
Student Enrollment Distribution by Race / Ethnicity
| Number | Percent | |
|---|---|---|
| American Indian | 7 | 1.5% |
| Black | 147 | 30.9% |
| Asian | 37 | 7.8% |
| Hispanic | 186 | 39.2% |
| White | 74 | 15.6% |
Number of Students Per Grade

| Number | Percent | |
|---|---|---|
| 9th Grade | 158 | 33.3% |
| 10th Grade | 131 | 27.6% |
| 11th Grade | 114 | 24.0% |
| 12th Grade | 71 | 14.9% |
| Ungraded | 1 | 0.2% |
Graduates Information (2010)
Graduation Rate
School:
91.4%
District:
78.7%
State:
78.6%
Teacher Education Background (2009)
Percent With Master's Degree
School:
12.5%
District:
14.6%
Percent With Bachelor's Degree
School:
41.7%
District:
33.0%
Teacher Credentials & Experience (2009)
Percent of Teachers With Emergency Credentials: 20.0%
Percent of Teachers With Credentials: 95.0%
Number of Certificated Staff: 24.0
Average Number of Years of Teacher Experience: 4.8
Average Age
School:
36.1
District:
45.1
Source: CA Department of Education, Source: NCES 2009-2010
School Ratings and Reviews
Be The First To Review Health Professions High School!
School Map and Similar Schools Nearby
Click to Activate Map of Nearby School Campuses
Private
Public
This School
Similar Schools Nearby
| C. K. Mcclatchy High School 9-12 | 2,198 Students | 1.5 miles away | Not Yet Rated | |
| River City High School 9-12 | 1,891 Students | 1.9 miles away |  5 out of 5 | |
| John F. Kennedy High School 9-12 | 2,093 Students | 4.2 miles away | Not Yet Rated | |
| West Campus School 9-12 | 833 Students | 4.5 miles away | Not Yet Rated | |
| Rio Tierra Junior High School 7-9 | 456 Students | 4.7 miles away | Not Yet Rated | |
| Natomas High School 9-12 | 1,456 Students | 4.8 miles away | Not Yet Rated | |
| Hiram W. Johnson High School 9-12 | 2,153 Students | 5.0 miles away | Not Yet Rated | |
| Luther Burbank High School 9-12 | 2,031 Students | 5.1 miles away | Not Yet Rated | |
| Encina High School 9-12 | 639 Students | 5.9 miles away |  3 out of 5 | |
| Grant Union High School 9-12 | 1,927 Students | 6.7 miles away | Not Yet Rated | |
Compare This School To Nearby Schools ->
School Community Forum

Join a discussion about Health Professions High School and talk to others in the community including students, parents, teachers, and administrators.
Popular Discussion Topics
- Admissions and Registration Questions (e.g. Dress Code and Discipline Policy)
- School Calendar and Upcoming Events (e.g. Graduation)
- After School Programs, Extracurricular Activities, and Athletics (e.g. Football)
- News and Announcements (e.g. Yearbook and Class Supply List Details)
- Graduate and Alumni Events (e.g. Organizing Class Reunions)
Navigation
Can't Find What You Are Looking For?
Rankings
Sponsored Links
K-12 Articles

Just a Harmless Vanilla Bean?
Some of the greatest, most used, and most profitable breakthroughs in science have not been made by...
Some of the greatest, most used, and most profitable breakthroughs in science have not been made by...

The Pros and Cons of Seat Belts in School Buses
Recently the news has been full of school bus accidents where children have been seriously injured...
Recently the news has been full of school bus accidents where children have been seriously injured...

Grammar...not Just Extended Family Anymore!
Can I talk to y'all abit about grammar? Right grammar and punctuations got to be some of the...
Can I talk to y'all abit about grammar? Right grammar and punctuations got to be some of the...