The Language Academy of Sacramento
Rating
Not Available
Not Available

No Reviews Yet
Find Old Friends From The Language Academy of Sacramento
Use the form below to search for alumni from The Language Academy of Sacramento.
School Description
School Summary and Highlights
- Enrolls 339 elementary school students from grades KG-8
- Ranks 853rd out of 2,050 middle schools in CA.
- 2010 Overall School AYP Met Status: No
Additional Contact Information
- Mailing Address: 4500 Roosevelt Ave., Sacramento, CA 95820
School Operational Details
- Title I Eligible
- Charter School
School District Details
- Sacramento City Unified School District
- Per-Pupil Spending: $10,051
- Graduation Rate: 57.9%
- Dropout Rate: 3.7%
- Students Per Teacher: 21.2
- Enrolled Students: 47,532
Faculty Details and Student Enrollment
Students and Faculty
- Total Students Enrolled: 339
- Total Full Time "Equivalent" Teachers: 15.5
- Average Student-To-Teacher Ratio: 21.9
Students Gender Breakdown
- Males: 172 (50.7%)
- Females: 167 (49.3%)
Free Lunch Student Eligibility Breakdown
- Eligible for Reduced Lunch: 29 (8.6%)
- Eligible for Free Lunch: 240 (70.8%)
- Eligible for Either Reduced or Free Lunch: 269 (79.4%)
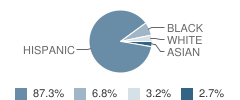
Student Enrollment Distribution by Race / Ethnicity
| Number | Percent | |
|---|---|---|
| American Indian | - | - |
| Black | 23 | 6.8% |
| Asian | 9 | 2.7% |
| Hispanic | 296 | 87.3% |
| White | 11 | 3.2% |
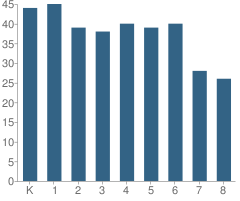
Number of Students Per Grade
| Number | Percent | |
|---|---|---|
| Kindergarten | 44 | 13.0% |
| 1st Grade | 45 | 13.3% |
| 2nd Grade | 39 | 11.5% |
| 3rd Grade | 38 | 11.2% |
| 4th Grade | 40 | 11.8% |
| 5th Grade | 39 | 11.5% |
| 6th Grade | 40 | 11.8% |
| 7th Grade | 28 | 8.3% |
| 8th Grade | 26 | 7.7% |
Teacher Education Background (2009)
Percent With Master's Degree
School:
9.5%
District:
14.6%
Percent With Bachelor's Degree
School:
4.8%
District:
33.0%
Teacher Credentials & Experience (2009)
Percent of Teachers With Credentials: 100.0%
Number of Certificated Staff: 21.0
Average Number of Years of Teacher Experience: 7.8
Average Age
School:
32.9
District:
45.1
Source: CA Department of Education, Source: NCES 2009-2010
School Ratings and Reviews
Be The First To Review The Language Academy of Sacramento!
School Map and Similar Schools Nearby
Click to Activate Map of Nearby School Campuses
Private
Public
This School
Similar Schools Nearby
| St. Hope Public School 7 (Ps7) KG-8 | 378 Students | 0.8 miles away |  5 out of 5 | |
| Capitol Heights Academy KG-8 | 216 Students | 1.7 miles away | Not Yet Rated | |
| Bowling Green Elementary School KG-6 | 735 Students | 2.2 miles away | Not Yet Rated | |
| California Montessori Project-Capitol Campus School KG-8 | 198 Students | 2.8 miles away | Not Yet Rated | |
| Sol Aureus College Preparatory School 5-8 | 75 Students | 3.7 miles away | Not Yet Rated | |
| Higher Learning Academy KG-12 | 137 Students | 5.7 miles away | Not Yet Rated | - |
| Smythe Academy of Arts and Sciences KG-8 | 1,025 Students | 5.7 miles away | Not Yet Rated | |
| Aspire Alexander Twilight College Preparatory School KG-8 | 338 Students | 5.9 miles away | Not Yet Rated | - |
| Ca. Montessori Project-San Juan Ar / Car Campuses School KG-8 | 689 Students | 8.7 miles away | Not Yet Rated | |
| Options for Youth-San Juan School KG-12 | 1,207 Students | 8.7 miles away | Not Yet Rated | |
Compare This School To Nearby Schools ->
School Community Forum

Join a discussion about The Language Academy of Sacramento and talk to others in the community including students, parents, teachers, and administrators.
Popular Discussion Topics
- Admissions and Registration Questions (e.g. Dress Code and Discipline Policy)
- School Calendar and Upcoming Events (e.g. Graduation)
- After School Programs, Extracurricular Activities, and Athletics (e.g. Football)
- News and Announcements (e.g. Yearbook and Class Supply List Details)
- Graduate and Alumni Events (e.g. Organizing Class Reunions)
Navigation
Can't Find What You Are Looking For?
Rankings
Nearby Cities
Sponsored Links
K-12 Articles

The Impact on Adopted Children at School
Children who are adopted can be affected both academically and socially at school. Many times...
Children who are adopted can be affected both academically and socially at school. Many times...

Keep Morning Stress at a Minimum: Establish a Routine
Morning! It can be a time of stress. The kids are fighting over who gets to use the bathroom first,...
Morning! It can be a time of stress. The kids are fighting over who gets to use the bathroom first,...

Who is Safe?
Between September 26 and October 2, 2006, there were three deadly school shootings and...
Between September 26 and October 2, 2006, there were three deadly school shootings and...