School of Science, Connections, and Technology
Rating
Not Available
Not Available

No Reviews Yet
Find Old Friends From School of Science, Connections, and Technology
Use the form below to search for alumni from School of Science, Connections, and Technology.
School Description
School Summary and Highlights
- Enrolls 492 high school students from grades 9-12
- Ranks 412th out of 1,197 high schools in CA.
- 2010 Overall School AYP Met Status: No
School Operational Details
- Title I EligibleAll students of this school are eligible for participation in authorized programs.
School District Details
- San Diego Unified School District
- Per-Pupil Spending: $10,305
- Graduation Rate: 63.0%
- Dropout Rate: 2.4%
- Students Per Teacher: 20.1
- Enrolled Students: 131,163
Faculty Details and Student Enrollment
Students and Faculty
- Total Students Enrolled: 492
- Total Full Time "Equivalent" Teachers: 20.3
- Average Student-To-Teacher Ratio: 24.3
Students Gender Breakdown
- Males: 238 (48.4%)
- Females: 254 (51.6%)
Free Lunch Student Eligibility Breakdown
- Eligible for Reduced Lunch: 4 (0.8%)
- Eligible for Free Lunch: 384 (78.0%)
- Eligible for Either Reduced or Free Lunch: 388 (78.9%)
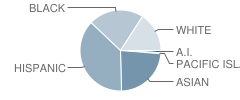
Student Enrollment Distribution by Race / Ethnicity
| Number | Percent | |
|---|---|---|
| American Indian | 5 | 1.0% |
| Black | 107 | 21.7% |
| Asian | 113 | 23.0% |
| Hispanic | 181 | 36.8% |
| White | 77 | 15.7% |
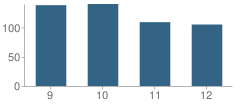
Number of Students Per Grade
| Number | Percent | |
|---|---|---|
| 9th Grade | 138 | 28.0% |
| 10th Grade | 140 | 28.5% |
| 11th Grade | 109 | 22.2% |
| 12th Grade | 105 | 21.3% |
Graduates Information (2010)
Graduation Rate
School:
81.3%
District:
79.3%
State:
78.6%
Teacher Education Background (2009)
Percent With Master's Degree
School:
83.3%
District:
80.1%
Percent With Bachelor's Degree
School:
13.3%
District:
16.8%
Teacher Credentials & Experience (2009)
Percent of Teachers With Credentials: 100.0%
Number of Certificated Staff: 30.0
Average Number of Years of Teacher Experience: 15.5
Average Age
School:
45.6
District:
46.6
Source: CA Department of Education, Source: NCES 2009-2010
School Ratings and Reviews
Be The First To Review School of Science, Connections, and Technology!
School Map and Similar Schools Nearby
Click to Activate Map of Nearby School Campuses
Private
Public
This School
Similar Schools Nearby
| School of International Business at Kearny High Education 9-12 | 454 Students | 0 miles away | Not Yet Rated | |
| Madison High School 9-12 | 1,246 Students | 2.3 miles away |  3 out of 5 | |
| Clairemont High School 9-12 | 1,451 Students | 2.4 miles away | Not Yet Rated | |
| John Muir School KG-12 | 380 Students | 2.5 miles away | Not Yet Rated | |
| Mission Bay High School 9-12 | 1,622 Students | 3.6 miles away | Not Yet Rated | |
| Serra High School 9-12 | 2,087 Students | 3.6 miles away | Not Yet Rated | |
| Hoover High School 9-12 | 2,163 Students | 4.7 miles away | Not Yet Rated | |
| University City High School 9-12 | 1,852 Students | 5.1 miles away | Not Yet Rated | |
| Scitech High School 9-12 | 554 Students | 5.6 miles away | Not Yet Rated | |
| Point Loma High School 9-12 | 2,115 Students | 5.6 miles away | Not Yet Rated | |
Compare This School To Nearby Schools ->
School Community Forum

Join a discussion about School of Science, Connections, and Technology and talk to others in the community including students, parents, teachers, and administrators.
Popular Discussion Topics
- Admissions and Registration Questions (e.g. Dress Code and Discipline Policy)
- School Calendar and Upcoming Events (e.g. Graduation)
- After School Programs, Extracurricular Activities, and Athletics (e.g. Football)
- News and Announcements (e.g. Yearbook and Class Supply List Details)
- Graduate and Alumni Events (e.g. Organizing Class Reunions)
Navigation
Can't Find What You Are Looking For?
Rankings
Nearby Cities
Sponsored Links
K-12 Articles

Public or Private?
Daniel attended private school until sixth grade, when he was diagnosed with Asperger's Syndrome, a...
Daniel attended private school until sixth grade, when he was diagnosed with Asperger's Syndrome, a...

It's the Most Wonderful Time of the Year!
For most of the country, school is starting up this week or later this month-at the beginning of...
For most of the country, school is starting up this week or later this month-at the beginning of...

Feeling Good in Your Own Skin
Body image is a very touchy issue with today's kids. Since the 1950s, when Barbie was first...
Body image is a very touchy issue with today's kids. Since the 1950s, when Barbie was first...