Ocean Grove Charter School
Rating
Not Available
Not Available

No Reviews Yet
Find Old Friends From Ocean Grove Charter School
Use the form below to search for alumni from Ocean Grove Charter School.
School Description
School Summary and Highlights
- Enrolls 1,156 elementary, middle, and high school students from grades KG-12
- Ranks 572nd out of 1,197 high schools in CA.
- 2010 Overall School AYP Met Status: No
Additional Contact Information
- Mailing Address: 1166 Broadway, Ste. Q, Placerville, CA 95667
School Operational Details
- Charter School
School District Details
- San Lorenzo Valley Unified School District
- Per-Pupil Spending: $6,772
- Graduation Rate: 91.8%
- Dropout Rate: 2.9%
- Students Per Teacher: 19.3
- Enrolled Students: 3,770
Faculty Details and Student Enrollment
Students and Faculty
- Total Students Enrolled: 1,156
- Total Full Time "Equivalent" Teachers: 55.1
- Average Student-To-Teacher Ratio: 21.0
Students Gender Breakdown
- Males: 560 (48.4%)
- Females: 596 (51.6%)
Free Lunch Student Eligibility Breakdown
- Eligible for Reduced Lunch: 136 (11.8%)
- Eligible for Free Lunch: 104 (9.0%)
- Eligible for Either Reduced or Free Lunch: 240 (20.8%)
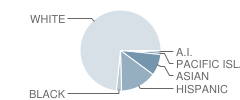
Student Enrollment Distribution by Race / Ethnicity
| Number | Percent | |
|---|---|---|
| American Indian | 10 | 0.9% |
| Black | 25 | 2.2% |
| Asian | 93 | 8.0% |
| Hispanic | 155 | 13.4% |
| White | 776 | 67.1% |
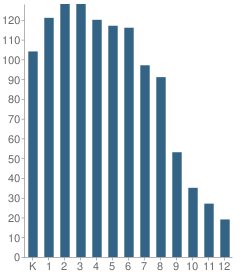
Number of Students Per Grade
| Number | Percent | |
|---|---|---|
| Kindergarten | 104 | 9.0% |
| 1st Grade | 121 | 10.5% |
| 2nd Grade | 128 | 11.1% |
| 3rd Grade | 128 | 11.1% |
| 4th Grade | 120 | 10.4% |
| 5th Grade | 117 | 10.1% |
| 6th Grade | 116 | 10.0% |
| 7th Grade | 97 | 8.4% |
| 8th Grade | 91 | 7.9% |
| 9th Grade | 53 | 4.6% |
| 10th Grade | 35 | 3.0% |
| 11th Grade | 27 | 2.3% |
| 12th Grade | 19 | 1.6% |
Teacher Education Background (2009)
Percent With Ph.D.: 1.8%
Percent With Master's Degree: 34.5%
Percent With Bachelor's Degree
School:
58.2%
District:
18.2%
Teacher Credentials & Experience (2009)
Percent of Teachers With Credentials: 100.0%
Number of Certificated Staff: 55.0
Average Number of Years of Teacher Experience: 4.4
Average Age
School:
44.8
District:
47.5
Source: CA Department of Education, Source: NCES 2009-2010
School Ratings and Reviews
Be The First To Review Ocean Grove Charter School!
School Map and Similar Schools Nearby
Click to Activate Map of Nearby School Campuses
Private
Public
This School
Similar Schools Nearby
| Sky Mountain Charter School KG-12 | 1,373 Students | 0 miles away | Not Yet Rated | - |
| Shenandoah High School 9-12 | 96 Students | 4.3 miles away | Not Yet Rated | |
Compare This School To Nearby Schools ->
School Community Forum

Join a discussion about Ocean Grove Charter School and talk to others in the community including students, parents, teachers, and administrators.
Popular Discussion Topics
- Admissions and Registration Questions (e.g. Dress Code and Discipline Policy)
- School Calendar and Upcoming Events (e.g. Graduation)
- After School Programs, Extracurricular Activities, and Athletics (e.g. Football)
- News and Announcements (e.g. Yearbook and Class Supply List Details)
- Graduate and Alumni Events (e.g. Organizing Class Reunions)
Navigation
Can't Find What You Are Looking For?
Rankings
Nearby Cities
Sponsored Links
K-12 Articles

Preparing Your Child for the First Day of School
It seems like school was just dismissed for the summer, yet here we are facing another year of back...
It seems like school was just dismissed for the summer, yet here we are facing another year of back...

When Bad Report Cards Happen to Good Kids
It's mid-term season once again, and semester (or quarter or trimester) grades will be coming out...
It's mid-term season once again, and semester (or quarter or trimester) grades will be coming out...

Keeping Our Kids Safe in the Post 9/11 World
Recently, radio talk show host and CNN personality did a week-long special entitled "The Perfect...
Recently, radio talk show host and CNN personality did a week-long special entitled "The Perfect...