The School of Arts and Enterprise
Rating
Not Available
Not Available

5 out of 5 | 1 Review
Find Old Friends From The School of Arts and Enterprise
Use the form below to search for alumni from The School of Arts and Enterprise.
School Description
School Summary and Highlights
- Enrolls 415 high school students from grades 9-12
- Ranks 974th out of 1,197 high schools in CA.
- 2010 Overall School AYP Met Status: No
Additional Contact Information
- Mailing Address: 295 North Garey Ave., Pomona, CA 91767
School Operational Details
- Title I Eligible
- Charter School
Faculty Details and Student Enrollment
Students and Faculty
- Total Students Enrolled: 415
- Total Full Time "Equivalent" Teachers: 16.0
- Average Student-To-Teacher Ratio: 25.9
Students Gender Breakdown
- Males: 179 (43.1%)
- Females: 236 (56.9%)
Free Lunch Student Eligibility Breakdown
- Eligible for Reduced Lunch: 53 (12.8%)
- Eligible for Free Lunch: 235 (56.6%)
- Eligible for Either Reduced or Free Lunch: 288 (69.4%)
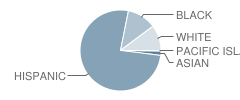
Student Enrollment Distribution by Race / Ethnicity
| Number | Percent | |
|---|---|---|
| American Indian | - | - |
| Black | 48 | 11.6% |
| Asian | 7 | 1.7% |
| Hispanic | 314 | 75.7% |
| White | 42 | 10.1% |
Number of Students Per Grade

| Number | Percent | |
|---|---|---|
| 8th Grade | 4 | 1.0% |
| 9th Grade | 100 | 24.1% |
| 10th Grade | 118 | 28.4% |
| 11th Grade | 107 | 25.8% |
| 12th Grade | 86 | 20.7% |
Graduates Information (2010)
Graduation Rate
School:
90.9%
State:
78.6%
Teacher Education Background (2009)
Percent With Ph.D.: 4.5%
Percent With Master's Degree: 27.3%
Percent With Bachelor's Degree: 9.1%
Teacher Credentials & Experience (2009)
Percent of Teachers With Credentials: 77.8%
Number of Certificated Staff: 22.0
Average Number of Years of Teacher Experience: 4.3
Average Age: 37.3
Source: CA Department of Education, Source: NCES 2009-2010
School Ratings and Reviews
Overall Rating: 5

5 out of 5 | 1 Review
The Overall Rating is the school's average rating from parents, students, school faculty and staff. The highest rating is five apples and the lowest is one apple.
Share Your Review About This School
1 review for The School of Arts and Enterprise
- Reviewed by Parent/Guardian on September 04, 2009
- Rating:
 (5 / 5) Flag as inappropriate
 - This school offers my daughter has a school where she can be herself. The school has made adjustments to meet her academic needs. The school also offers her the arts. The arts has been taken out of so many schools, with the budget cuts, but this school has made arrangements to keep the arts present in the student's every day learning!! I would highly recommend the SAE to other creative students!!
School Map and Similar Schools Nearby
Click to Activate Map of Nearby School Campuses
Private
Public
This School
Similar Schools Nearby
| School of Extended Educational Options 7-12 | 153 Students | 1.7 miles away | Not Yet Rated | - |
Compare This School To Nearby Schools ->
School Community Forum

Join a discussion about The School of Arts and Enterprise and talk to others in the community including students, parents, teachers, and administrators.
Popular Discussion Topics
- Admissions and Registration Questions (e.g. Dress Code and Discipline Policy)
- School Calendar and Upcoming Events (e.g. Graduation)
- After School Programs, Extracurricular Activities, and Athletics (e.g. Football)
- News and Announcements (e.g. Yearbook and Class Supply List Details)
- Graduate and Alumni Events (e.g. Organizing Class Reunions)
Navigation
Can't Find What You Are Looking For?
Rankings
Nearby Cities
Sponsored Links
K-12 Articles

Special Needs Education: Your Child, Your Rights
Many children today have special needs that make it difficult for them to learn. It's imperative...
Many children today have special needs that make it difficult for them to learn. It's imperative...

Siblings and Individual Identity in High School
When the first day of high school looms in the near future, teens are both excited and anxious....
When the first day of high school looms in the near future, teens are both excited and anxious....

Exciting School Lunch Ideas
Earlier this week I had reason to drop by my grandsons' school at lunch time. While waiting for the...
Earlier this week I had reason to drop by my grandsons' school at lunch time. While waiting for the...