Institute of Business, Management, and Law Charter School

No Reviews Yet
Find Old Friends From Institute of Business, Management, and Law Charter School
Use the form below to search for alumni from Institute of Business, Management, and Law Charter School.
School Description
School Summary and Highlights
- Enrolls 321 high school students from grades 9-12
- Ranks 662nd out of 1,197 high schools in CA.
- 2010 Overall School AYP Met Status: Yes
Additional Contact Information
- Mailing Address: 6650 Inglewood Ave., Stockton, CA 95207
School Operational Details
- Title I Eligible
- Charter School
School District Details
- Stockton Unified School District
- Per-Pupil Spending: $9,602
- Graduation Rate: 52.7%
- Dropout Rate: 4.4%
- Students Per Teacher: 19.9
- Enrolled Students: 38,102
Faculty Details and Student Enrollment
Students and Faculty
- Total Students Enrolled: 321
- Total Full Time "Equivalent" Teachers: 15.0
- Average Student-To-Teacher Ratio: 21.4
Students Gender Breakdown
- Males: 125 (38.9%)
- Females: 196 (61.1%)
Free Lunch Student Eligibility Breakdown
- Eligible for Reduced Lunch: 45 (14.0%)
- Eligible for Free Lunch: 182 (56.7%)
- Eligible for Either Reduced or Free Lunch: 227 (70.7%)
Student Enrollment Distribution by Race / Ethnicity
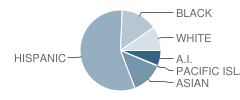
| Number | Percent | |
|---|---|---|
| American Indian | 20 | 6.2% |
| Black | 47 | 14.6% |
| Asian | 41 | 12.8% |
| Hispanic | 180 | 56.1% |
| White | 31 | 9.7% |
Number of Students Per Grade

| Number | Percent | |
|---|---|---|
| 8th Grade | 6 | 1.9% |
| 9th Grade | 82 | 25.5% |
| 10th Grade | 96 | 29.9% |
| 11th Grade | 80 | 24.9% |
| 12th Grade | 57 | 17.8% |
Teacher Education Background (2009)
Percent With Ph.D.
School:
5.9%
District:
11.0%
Percent With Master's Degree
School:
64.7%
District:
72.5%
Percent With Bachelor's Degree
School:
29.4%
District:
16.5%
Teacher Credentials & Experience (2009)
Percent of Teachers With Credentials: 100.0%
Number of Certificated Staff: 17.0
Average Number of Years of Teacher Experience: 9.2
Average Age
School:
42.7
District:
47.4
Source: CA Department of Education, Source: NCES 2009-2010
School Ratings and Reviews
Be The First To Review Institute of Business, Management, and Law Charter School!
Sponsored Links
Test Scores and Performance Information
Overall School Rating
How is this determined?
The overall school rating shows that Institute of Business, Management, and Law Charter School performed on average about the same as other schools across the state on CST state exams in the following subjects:
- CST Algebra I
- CST Algebra II
- CST Biology
- CST Chemistry
- CST Earth Science
- CST English-Language Arts
- CST General Mathematics
- CST Geometry
- CST Physics
- CST Science
- CST Summative High School Math
- CST U.S. History
- CST World History
AYP Results (2010)
Overall AYP Met: Yes
ELA AYP Met: Yes
Math AYP Met: Yes
ACT Exam Results (2009)
Percent of Students Taking ACT Exam: 33.3%
Average Combined Score: 18.1
Percent Scoring At or Above 21: 25.0%
SAT Exam Results (2009)
Percent of Students Taking SAT Exam: 87.5%
Average Combined Score: 1,259.1
Critical Reading Average: 413.6
Math Average: 422.4
Writing Average: 423.1
Percent Scoring At or Above 1500: 16.7%
CST - Test Proficiency by Grade and Subject
Grade 9 - % of students at or above proficiency
| School | District | State | |
|---|---|---|---|
| CST Algebra I Test | |||
| 2010 | 28.0% | 10.0% | 22.0% |
| 2009 | 21.0% | 12.0% | 21.0% |
| 2008 | 10.0% | 4.0% | 18.0% |
| CST Biology Test | |||
| 2010 | 37.0% | 29.0% | 55.0% |
| CST English-Language Arts Test | |||
| 2010 | 67.0% | 39.0% | 54.0% |
| 2009 | 49.0% | 34.0% | 50.0% |
| 2008 | 33.0% | 29.0% | 49.0% |
| CST Geometry Test | |||
| 2010 | 46.0% | 24.0% | 46.0% |
| 2009 | 40.0% | 22.0% | 47.0% |
| 2008 | 25.0% | 16.0% | 43.0% |
| CST Earth Science Test | |||
| 2009 | 26.0% | 15.0% | 29.0% |
| 2008 | 18.0% | 15.0% | 31.0% |
| CST General Mathematics Test | |||
| 2008 | 41.0% | 19.0% | 18.0% |
Grade 10 - % of students at or above proficiency
| School | District | State | |
|---|---|---|---|
| CST Algebra II Test | |||
| 2010 | 45.0% | 23.0% | 40.0% |
| 2009 | 7.0% | 16.0% | 37.0% |
| 2008 | 17.0% | 8.0% | 36.0% |
| CST Biology Test | |||
| 2010 | 45.0% | 21.0% | 38.0% |
| 2009 | 25.0% | 16.0% | 34.0% |
| 2008 | 39.0% | 16.0% | 35.0% |
| CST English-Language Arts Test | |||
| 2010 | 49.0% | 27.0% | 45.0% |
| 2009 | 38.0% | 25.0% | 44.0% |
| 2008 | 41.0% | 23.0% | 41.0% |
| CST Geometry Test | |||
| 2010 | 4.0% | 3.0% | 14.0% |
| 2009 | 2.0% | 2.0% | 14.0% |
| 2008 | 14.0% | 3.0% | 12.0% |
| CST Science Test | |||
| 2010 | 45.0% | 24.0% | 46.0% |
| 2009 | 30.0% | 23.0% | 44.0% |
| 2008 | 31.0% | 18.0% | 40.0% |
| CST World History Test | |||
| 2010 | 32.0% | 20.0% | 42.0% |
| 2009 | 22.0% | 15.0% | 38.0% |
| 2008 | 16.0% | 11.0% | 33.0% |
| CST Algebra I Test | |||
| 2009 | 5.0% | 7.0% | 11.0% |
| 2008 | 24.0% | 5.0% | 9.0% |
Grade 11 - % of students at or above proficiency
| School | District | State | |
|---|---|---|---|
| CST Algebra II Test | |||
| 2010 | 9.0% | 3.0% | 14.0% |
| 2009 | 23.0% | 3.0% | 12.0% |
| CST Chemistry Test | |||
| 2010 | 15.0% | 16.0% | 30.0% |
| 2009 | 17.0% | 15.0% | 27.0% |
| CST English-Language Arts Test | |||
| 2010 | 47.0% | 25.0% | 42.0% |
| 2009 | 54.0% | 20.0% | 40.0% |
| 2008 | 32.0% | 18.0% | 37.0% |
| CST Geometry Test | |||
| 2010 | 6.0% | 3.0% | 6.0% |
| CST Physics Test | |||
| 2010 | 58.0% | 45.0% | 53.0% |
| 2009 | 47.0% | 44.0% | 50.0% |
| 2008 | 15.0% | 25.0% | 47.0% |
| CST Summative High School Math Test | |||
| 2010 | 7.0% | 19.0% | 50.0% |
| 2009 | 31.0% | 11.0% | 47.0% |
| CST U.S. History Test | |||
| 2010 | 43.0% | 22.0% | 45.0% |
| 2009 | 58.0% | 22.0% | 44.0% |
| 2008 | 34.0% | 15.0% | 38.0% |
| CST Biology Test | |||
| 2008 | 23.0% | 17.0% | 39.0% |
End of Course - % of students at or above proficiency
| School | District | State | |
|---|---|---|---|
| CST Algebra I Test | |||
| 2010 | 27.0% | 18.0% | 31.0% |
| 2009 | 16.0% | 20.0% | 28.0% |
| 2008 | 15.0% | 13.0% | 25.0% |
| CST Algebra II Test | |||
| 2010 | 26.0% | 15.0% | 31.0% |
| 2009 | 18.0% | 10.0% | 28.0% |
| 2008 | 8.0% | 6.0% | 27.0% |
| CST Biology Test | |||
| 2010 | 40.0% | 25.0% | 46.0% |
| 2009 | 29.0% | 20.0% | 42.0% |
| 2008 | 37.0% | 20.0% | 42.0% |
| CST Chemistry Test | |||
| 2010 | 18.0% | 19.0% | 38.0% |
| 2009 | 17.0% | 17.0% | 36.0% |
| CST Geometry Test | |||
| 2010 | 17.0% | 10.0% | 27.0% |
| 2009 | 17.0% | 10.0% | 26.0% |
| 2008 | 12.0% | 9.0% | 24.0% |
| CST Physics Test | |||
| 2010 | 58.0% | 44.0% | 49.0% |
| 2009 | 47.0% | 47.0% | 46.0% |
| 2008 | 15.0% | 25.0% | 43.0% |
| CST Summative High School Math Test | |||
| 2010 | 7.0% | 21.0% | 54.0% |
| 2009 | 31.0% | 12.0% | 50.0% |
| CST World History Test | |||
| 2010 | 32.0% | 22.0% | 41.0% |
| 2009 | 22.0% | 16.0% | 38.0% |
| 2008 | 16.0% | 13.0% | 33.0% |
| CST Earth Science Test | |||
| 2009 | 25.0% | 13.0% | 28.0% |
| 2008 | 22.0% | 14.0% | 28.0% |
| CST General Mathematics Test | |||
| 2008 | 41.0% | 18.0% | 27.0% |
Source: CA Department of Education 2009-2010
School Map and Similar Schools Nearby
Click to Activate Map of Nearby School Campuses
Private
Public
This School
Similar Schools Nearby
| Benjamin Holt College Preparatory Academy 6-12 | 578 Students | 2.9 miles away | ![]() 1 out of 5 | |
| Aspire Langston Hughes Academy 6-12 | 270 Students | 3.6 miles away | Not Yet Rated | - |
| Stockton Unified Early College Academy 9-12 | 118 Students | 3.8 miles away | Not Yet Rated | - |
| Stockton Alternative High School 9-12 | 163 Students | 4.3 miles away | Not Yet Rated | - |
| Dr. Lewis Dolphin Stallworth Sr. Charter School KG-12 | 116 Students | 4.6 miles away | Not Yet Rated | - |
| Career & Technical High School 9-12 | 123 Students | 8.5 miles away | Not Yet Rated | - |
Compare This School To Nearby Schools ->
School Community Forum

Join a discussion about Institute of Business, Management, and Law Charter School and talk to others in the community including students, parents, teachers, and administrators.
Popular Discussion Topics
- Admissions and Registration Questions (e.g. Dress Code and Discipline Policy)
- School Calendar and Upcoming Events (e.g. Graduation)
- After School Programs, Extracurricular Activities, and Athletics (e.g. Football)
- News and Announcements (e.g. Yearbook and Class Supply List Details)
- Graduate and Alumni Events (e.g. Organizing Class Reunions)
Navigation
Can't Find What You Are Looking For?
Rankings
Nearby Cities
Sponsored Links
K-12 Articles
Promoting Childhood Literacy
The number of American adults who are illiterate is astounding. People who lack the ability to read...
Beating the Summer Slump
"The Summer Slump", teachers call it. It happens every year. It makes its way into lesson plans...
Is Your Child's Teacher a Bully?
We've all heard about kids being bullied by peers. Kids taunt, tease, pull hair, shove and push...

