Parkridge Elementary School
Rating
Not Available
Not Available

No Reviews Yet
Find Old Friends From Parkridge Elementary School
Use the form below to search for alumni from Parkridge Elementary School.
School Description
School Summary and Highlights
- Enrolls 1,039 preschool and elementary school students from grades PK-8
- Ranks 35th out of 660 middle schools in AZ.
Additional Contact Information
- Mailing Address: 9970 W. Beardsley Road, Peoria, AZ 85382
School District Details
- Peoria Unified School District
- Per-Pupil Spending: $6,688
- Graduation Rate: 83.0%
- Dropout Rate: 1.5%
- Students Per Teacher: 18.5
- Enrolled Students: 37,422
Faculty Details and Student Enrollment
Students and Faculty
- Total Students Enrolled: 1,039
- Total Full Time "Equivalent" Teachers: 47.3
- Average Student-To-Teacher Ratio: 22.0
Students Gender Breakdown
- Males: 536 (51.6%)
- Females: 503 (48.4%)
Free Lunch Student Eligibility Breakdown
- Eligible for Reduced Lunch: 53 (5.1%)
- Eligible for Free Lunch: 137 (13.2%)
- Eligible for Either Reduced or Free Lunch: 190 (18.3%)
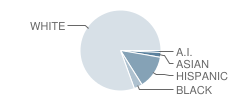
Student Enrollment Distribution by Race / Ethnicity
| Number | Percent | |
|---|---|---|
| American Indian | 8 | 0.8% |
| Black | 35 | 3.4% |
| Asian | 20 | 1.9% |
| Hispanic | 139 | 13.4% |
| White | 837 | 80.6% |
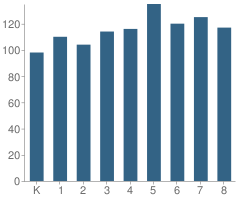
Number of Students Per Grade
| Number | Percent | |
|---|---|---|
| Kindergarten | 98 | 9.4% |
| 1st Grade | 110 | 10.6% |
| 2nd Grade | 104 | 10.0% |
| 3rd Grade | 114 | 11.0% |
| 4th Grade | 116 | 11.2% |
| 5th Grade | 135 | 13.0% |
| 6th Grade | 120 | 11.5% |
| 7th Grade | 125 | 12.0% |
| 8th Grade | 117 | 11.3% |
Faculty Educational Background (2006-07)
- Teachers with a Bachelor's Degree: 67%
- Teachers with a Master's Degree or Higher:33%
Faculty Salary and Experience (2006-2007)
- Average Teaching Experience: 4 Years
- Average Salary: $38,207
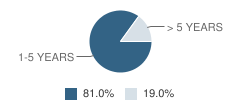
Teacher Experience by Number of Years
| Salary | Percent | |
|---|---|---|
| 1-5 Years of Teaching Experience | $36,441 | 81% |
| More Than 5 Years of Teaching Experience | $45,713 | 19% |
Source: AZ Department of Education, Source: NCES 2009-2010
School Ratings and Reviews
Be The First To Review Parkridge Elementary School!
School Map and Similar Schools Nearby
Click to Activate Map of Nearby School Campuses
Private
Public
This School
Similar Schools Nearby
| Coyote Hills Elementary School KG-8 | 1,441 Students | 1.6 miles away | Not Yet Rated | |
| Zuni Hills Elementary School PK-8 | 996 Students | 1.9 miles away | Not Yet Rated | |
| Apache Elementary School PK-8 | 847 Students | 2.1 miles away | Not Yet Rated | |
| Frontier Elementary School PK-8 | 1,219 Students | 2.4 miles away | Not Yet Rated | |
| Desert Harbor Elementary School PK-8 | 817 Students | 3.1 miles away |  5 out of 5 | |
| Arrowhead Elementary School PK-6 | 770 Students | 3.3 miles away | 5 out of 5 | |
| Sierra Verde Elementary School PK-8 | 768 Students | 3.4 miles away | 5 out of 5 | |
| Copper Creek Elementary School PK-6 | 864 Students | 3.9 miles away | Not Yet Rated | |
| Paseo Verde Elementary School PK-8 | 842 Students | 3.9 miles away | Not Yet Rated | |
| Thompson Ranch Elementary School KG-8 | 828 Students | 4.6 miles away | Not Yet Rated | |
Compare This School To Nearby Schools ->
School Community Forum

Join a discussion about Parkridge Elementary School and talk to others in the community including students, parents, teachers, and administrators.
Popular Discussion Topics
- Admissions and Registration Questions (e.g. Dress Code and Discipline Policy)
- School Calendar and Upcoming Events (e.g. Graduation)
- After School Programs, Extracurricular Activities, and Athletics (e.g. Football)
- News and Announcements (e.g. Yearbook and Class Supply List Details)
- Graduate and Alumni Events (e.g. Organizing Class Reunions)
Navigation
Can't Find What You Are Looking For?
Nearby Cities
Sponsored Links
K-12 Articles

Middle School Homework and Study Habits
The report cards came home and you're disappointed with your child's scores. You know he has the...
The report cards came home and you're disappointed with your child's scores. You know he has the...

Just a Harmless Vanilla Bean?
Some of the greatest, most used, and most profitable breakthroughs in science have not been made by...
Some of the greatest, most used, and most profitable breakthroughs in science have not been made by...

The Importance of Ninth Grade
Students who are entering ninth grade do not realize the importance of the critical decisions they...
Students who are entering ninth grade do not realize the importance of the critical decisions they...