Copper Canyon High School
Rating
Not Available
Not Available

No Reviews Yet
Find Old Friends From Copper Canyon High School
Use the form below to search for alumni from Copper Canyon High School.
School Description
School Summary and Highlights
- Enrolls 1,974 high school students from grades 9-12
- Ranks 219th out of 385 high schools in AZ.
School Operational Details
- Title I EligibleAll students of this school are eligible for participation in authorized programs.
School District Details
- Tolleson Union High School District
- Per-Pupil Spending: $7,095
- Dropout Rate: 2.8%
- Students Per Teacher: 21.3
- Enrolled Students: 9,133
Faculty Details and Student Enrollment
Students and Faculty
- Total Students Enrolled: 1,974
- Total Full Time "Equivalent" Teachers: 93.5
- Average Student-To-Teacher Ratio: 21.1
Students Gender Breakdown
- Males: 1,043 (52.8%)
- Females: 931 (47.2%)
Free Lunch Student Eligibility Breakdown
- Eligible for Reduced Lunch: 840 (42.6%)
- Eligible for Free Lunch: 132 (6.7%)
- Eligible for Either Reduced or Free Lunch: 972 (49.2%)
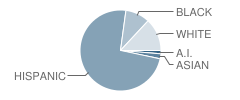
Student Enrollment Distribution by Race / Ethnicity
| Number | Percent | |
|---|---|---|
| American Indian | 26 | 1.3% |
| Black | 193 | 9.8% |
| Asian | 39 | 2.0% |
| Hispanic | 1,458 | 73.9% |
| White | 258 | 13.1% |
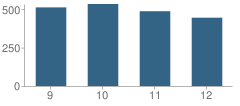
Number of Students Per Grade
| Number | Percent | |
|---|---|---|
| 9th Grade | 511 | 25.9% |
| 10th Grade | 533 | 27.0% |
| 11th Grade | 486 | 24.6% |
| 12th Grade | 444 | 22.5% |
Faculty Educational Background (2006-07)
- Teachers with a Bachelor's Degree: 64%
- Teachers with a Master's Degree or Higher:32%
Faculty Salary and Experience (2006-2007)
- Average Teaching Experience: 4 Years
- Average Salary: $43,507
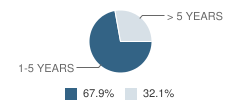
Teacher Experience by Number of Years
| Salary | Percent | |
|---|---|---|
| 1-5 Years of Teaching Experience | $40,951 | 68% |
| More Than 5 Years of Teaching Experience | $48,904 | 32% |
Source: AZ Department of Education, Source: NCES 2009-2010
School Ratings and Reviews
Be The First To Review Copper Canyon High School!
School Map and Similar Schools Nearby
Click to Activate Map of Nearby School Campuses
Private
Public
This School
Similar Schools Nearby
| Raymond S. Kellis School 9-12 | 1,785 Students | 2.5 miles away | Not Yet Rated | |
| Westview High School 9-12 | 2,453 Students | 2.5 miles away | Not Yet Rated | |
| Independence High School 9-12 | 1,863 Students | 2.6 miles away | Not Yet Rated | |
| Trevor Browne High School 9-12 | 3,006 Students | 2.9 miles away | Not Yet Rated | |
| Sierra Linda High School 9-12 | 624 Students | 4.1 miles away | Not Yet Rated | |
| Tolleson Union High School 9-12 | 2,194 Students | 4.2 miles away | Not Yet Rated | |
| Maryvale High School 9-12 | 2,606 Students | 4.3 miles away | Not Yet Rated | |
| Peoria High School 9-12 | 1,687 Students | 5.5 miles away | Not Yet Rated | |
| Apollo High School 9-12 | 1,856 Students | 6.3 miles away | Not Yet Rated | |
| Peoria Ecampus School KG-12 | 9 Students | 6.4 miles away | Not Yet Rated | - |
Compare This School To Nearby Schools ->
School Community Forum

Join a discussion about Copper Canyon High School and talk to others in the community including students, parents, teachers, and administrators.
Popular Discussion Topics
- Admissions and Registration Questions (e.g. Dress Code and Discipline Policy)
- School Calendar and Upcoming Events (e.g. Graduation)
- After School Programs, Extracurricular Activities, and Athletics (e.g. Football)
- News and Announcements (e.g. Yearbook and Class Supply List Details)
- Graduate and Alumni Events (e.g. Organizing Class Reunions)
Navigation
Can't Find What You Are Looking For?
Nearby Cities
Sponsored Links
K-12 Articles

Internet Safety for Kids of All Ages
Kids are being introduced to the Internet at a very young age. Research for homework and school...
Kids are being introduced to the Internet at a very young age. Research for homework and school...

Teacher Tenure: A Double-Edged Sword
Teacher Tenure (the policy making it almost impossible to fire teachers) has noble roots. It was...
Teacher Tenure (the policy making it almost impossible to fire teachers) has noble roots. It was...

Cell Phones... the Best Thing Since Sliced Bread or the Worst Invention in the World?
Cell phones are wonderful, the best things humans have ever invented! They help us keep in touch...
Cell phones are wonderful, the best things humans have ever invented! They help us keep in touch...