Franklin County Elementary School
Rating
Not Available
Not Available

No Reviews Yet
Find Old Friends From Franklin County Elementary School
Use the form below to search for alumni from Franklin County Elementary School.
School Description
School Summary and Highlights
- Enrolls 429 preschool and elementary school students from grades PK-5
- Ranks 360th out of 1,322 elementary schools in GA.
Additional Contact Information
- Mailing Address: P.o. Box 189, Carnesville, GA 30521
School Operational Details
- Title I EligibleAll students of this school are eligible for participation in authorized programs.
School District Details
- Franklin County School District
- Per-Pupil Spending: $8,903
- Graduation Rate: 57.7%
- Dropout Rate: 5.7%
- Students Per Teacher: 15.3
- Enrolled Students: 3,759
Faculty Details and Student Enrollment
Students and Faculty
- Total Students Enrolled: 429
- Total Full Time "Equivalent" Teachers: 30.5
- Average Student-To-Teacher Ratio: 14.1
Students Gender Breakdown
- Males: 241 (56.2%)
- Females: 188 (43.8%)
Free Lunch Student Eligibility Breakdown
- Eligible for Reduced Lunch: 60 (14.0%)
- Eligible for Free Lunch: 191 (44.5%)
- Eligible for Either Reduced or Free Lunch: 251 (58.5%)
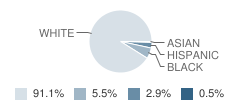
Student Enrollment Distribution by Race / Ethnicity
| Number | Percent | |
|---|---|---|
| American Indian | - | - |
| Black | 23 | 5.4% |
| Asian | 2 | 0.5% |
| Hispanic | 12 | 2.8% |
| White | 378 | 88.1% |
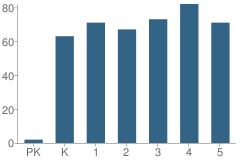
Number of Students Per Grade
| Number | Percent | |
|---|---|---|
| Pre-Kindergarten | 2 | 0.5% |
| Kindergarten | 63 | 14.7% |
| 1st Grade | 71 | 16.6% |
| 2nd Grade | 67 | 15.6% |
| 3rd Grade | 73 | 17.0% |
| 4th Grade | 82 | 19.1% |
| 5th Grade | 71 | 16.6% |
Source: GA Department of Education, Source: NCES 2009-2010
School Ratings and Reviews
Be The First To Review Franklin County Elementary School!
School Map and Similar Schools Nearby
Click to Activate Map of Nearby School Campuses
Private
Public
This School
Similar Schools Nearby
| Carnesville Elementary School PK-5 | 419 Students | 3.9 miles away |  4 out of 5 | |
| Royston Elementary School PK-5 | 468 Students | 11.5 miles away | Not Yet Rated | |
| Eastanollee Elementary School PK-5 | 515 Students | 11.9 miles away |  5 out of 5 | |
| Banks County Elementary School 3-5 | 726 Students | 11.9 miles away | Not Yet Rated | |
| Banks County Primary School PK-2 | 654 Students | 12.0 miles away | Not Yet Rated | |
| Ila Elementary School PK-5 | 424 Students | 12.3 miles away | 5 out of 5 | |
| Lavonia Elementary School PK-5 | 472 Students | 12.7 miles away | 5 out of 5 | |
| Liberty Elementary School PK-5 | 497 Students | 13.1 miles away | Not Yet Rated | |
| Big A Elementary School PK-5 | 518 Students | 13.5 miles away | 5 out of 5 | |
| Commerce Primary School PK-2 | 421 Students | 14.1 miles away | Not Yet Rated | |
Compare This School To Nearby Schools ->
School Community Forum

Join a discussion about Franklin County Elementary School and talk to others in the community including students, parents, teachers, and administrators.
Popular Discussion Topics
- Admissions and Registration Questions (e.g. Dress Code and Discipline Policy)
- School Calendar and Upcoming Events (e.g. Graduation)
- After School Programs, Extracurricular Activities, and Athletics (e.g. Football)
- News and Announcements (e.g. Yearbook and Class Supply List Details)
- Graduate and Alumni Events (e.g. Organizing Class Reunions)
Navigation
Can't Find What You Are Looking For?
Nearby Cities
Sponsored Links
K-12 Articles

Se Hablan Otras Idiomas?
In the late 1990s, the Salem-Keizer school district in Oregon began requiring every student in its...
In the late 1990s, the Salem-Keizer school district in Oregon began requiring every student in its...

Hurt: A Book Report
My last book report was over 15 years ago, and I'm a bit rusty, but here goes (Don't forget: book...
My last book report was over 15 years ago, and I'm a bit rusty, but here goes (Don't forget: book...

Simple Math ... a Simple Gift
Math affects every aspect of our lives-from balancing the checkbook to estimating the amount of...
Math affects every aspect of our lives-from balancing the checkbook to estimating the amount of...