Bridgeport Elementary School
Rating
Not Available
Not Available

5 out of 5 | 1 Review
Find Old Friends From Bridgeport Elementary School
Use the form below to search for alumni from Bridgeport Elementary School.
School Description
School Summary and Highlights
- Enrolls 849 preschool and elementary school students from grades PK-6
- Ranks 825th out of 1,142 elementary schools in IN.
Additional Contact Information
- Mailing Address: 9035 W Morris St, Indianapolis, IN 46231
- Principal or Admin: O'day Cheri
- Fax: (317) 390-0351
School Operational Details
- Title I EligibleAll students of this school are eligible for participation in authorized programs.
School District Details
- Wayne Township School District
- Per-Pupil Spending: $10,022
- Graduation Rate: 69.9%
- Dropout Rate: 3.0%
- Students Per Teacher: 17.8
- Enrolled Students: 15,807
Faculty Details and Student Enrollment
Students and Faculty
- Total Students Enrolled: 849
- Total Full Time "Equivalent" Teachers: 44.0
- Average Student-To-Teacher Ratio: 19.3
Students Gender Breakdown
- Males: 425 (50.1%)
- Females: 362 (42.6%)
Free Lunch Student Eligibility Breakdown
- Eligible for Reduced Lunch: 108 (12.7%)
- Eligible for Free Lunch: 341 (40.2%)
- Eligible for Either Reduced or Free Lunch: 449 (52.9%)
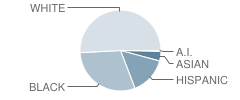
Student Enrollment Distribution by Race / Ethnicity
| Number | Percent | |
|---|---|---|
| American Indian | 3 | 0.4% |
| Black | 236 | 27.8% |
| Asian | 30 | 3.5% |
| Hispanic | 118 | 13.9% |
| White | 400 | 47.1% |
Number of Students Per Grade

| Number | Percent | |
|---|---|---|
| Pre-Kindergarten | 41 | 4.8% |
| Kindergarten | 102 | 12.0% |
| 1st Grade | 114 | 13.4% |
| 2nd Grade | 106 | 12.5% |
| 3rd Grade | 125 | 14.7% |
| 4th Grade | 119 | 14.0% |
| 5th Grade | 103 | 12.1% |
| 6th Grade | 139 | 16.4% |
Source: IN Department of Education, Source: NCES 2009-2010
School Ratings and Reviews
Overall Rating: 5

5 out of 5 | 1 Review
The Overall Rating is the school's average rating from parents, students, school faculty and staff. The highest rating is five apples and the lowest is one apple.
Share Your Review About This School
1 review for Bridgeport Elementary School
- Reviewed by Parent/Guardian on December 18, 2009
- Rating:
 (5 / 5) Flag as inappropriate
 - it's great!
School Map and Similar Schools Nearby
Click to Activate Map of Nearby School Campuses
Private
Public
This School
Similar Schools Nearby
| Chapel Glen Elementary School PK-6 | 824 Students | 1.8 miles away | Not Yet Rated | |
| Mcclelland Elementary School PK-6 | 683 Students | 2.4 miles away | Not Yet Rated | |
| Westlake Elementary School PK-6 | 814 Students | 2.8 miles away | Not Yet Rated | |
| Chapelwood Elementary School PK-6 | 764 Students | 3.0 miles away | Not Yet Rated | |
| Pine Tree Elementary School KG-4 | 540 Students | 3.3 miles away | Not Yet Rated | |
| Sycamore Elementary School KG-4 | 537 Students | 3.8 miles away | Not Yet Rated | |
| Maple Elementary School KG-4 | 517 Students | 4.0 miles away | Not Yet Rated | |
| White Oak Elementary School KG-4 | 432 Students | 4.0 miles away | Not Yet Rated | |
| Hickory Elementary School PK-4 | 593 Students | 4.1 miles away |  1 out of 5 | |
| Cedar Elementary School PK-4 | 689 Students | 4.1 miles away | Not Yet Rated | |
Compare This School To Nearby Schools ->
School Community Forum

Join a discussion about Bridgeport Elementary School and talk to others in the community including students, parents, teachers, and administrators.
Popular Discussion Topics
- Admissions and Registration Questions (e.g. Dress Code and Discipline Policy)
- School Calendar and Upcoming Events (e.g. Graduation)
- After School Programs, Extracurricular Activities, and Athletics (e.g. Football)
- News and Announcements (e.g. Yearbook and Class Supply List Details)
- Graduate and Alumni Events (e.g. Organizing Class Reunions)
Navigation
Can't Find What You Are Looking For?
Nearby Cities
Sponsored Links
K-12 Articles

Strategies to Help Kids Cope with Stress
Many parents believe that kids don’t experience stress. Nothing could be further from the truth....
Many parents believe that kids don’t experience stress. Nothing could be further from the truth....

Keep Your Licensed Teen Safe This Summer
Every year hundreds of teenage drivers lose their lives in motor vehicle accidents. Statistics show...
Every year hundreds of teenage drivers lose their lives in motor vehicle accidents. Statistics show...

Breakfast, Kids and Learning
For generations parents have been telling their kids that breakfast is the most important meal of...
For generations parents have been telling their kids that breakfast is the most important meal of...