Schurr High School

5 out of 5 | 1 Review
Find Old Friends From Schurr High School
Use the form below to search for alumni from Schurr High School.
School Description
School Summary and Highlights
- Enrolls 3,548 high school students from grades 9-12
- Ranks 543rd out of 1,197 high schools in CA.
- 2010 Overall School AYP Met Status: No
Additional Contact Information
- Mailing Address: 820 North Wilcox Ave., Montebello, CA 90640
School District Details
- Montebello Unified School District
- Per-Pupil Spending: $9,144
- Graduation Rate: 63.0%
- Dropout Rate: 2.3%
- Students Per Teacher: 24.6
- Enrolled Students: 32,700
Faculty Details and Student Enrollment
Students and Faculty
- Total Students Enrolled: 3,548
- Total Full Time "Equivalent" Teachers: 125.0
- Average Student-To-Teacher Ratio: 28.4
Students Gender Breakdown
- Males: 1,799 (50.7%)
- Females: 1,749 (49.3%)
Free Lunch Student Eligibility Breakdown
- Eligible for Reduced Lunch: 490 (13.8%)
- Eligible for Free Lunch: 1,961 (55.3%)
- Eligible for Either Reduced or Free Lunch: 2,451 (69.1%)
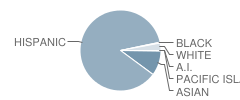
Student Enrollment Distribution by Race / Ethnicity

| Number | Percent | |
|---|---|---|
| American Indian | 4 | 0.1% |
| Black | 15 | 0.4% |
| Asian | 350 | 9.9% |
| Hispanic | 3,057 | 86.2% |
| White | 104 | 2.9% |
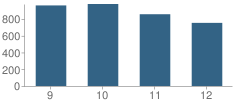
Number of Students Per Grade

| Number | Percent | |
|---|---|---|
| 9th Grade | 961 | 27.1% |
| 10th Grade | 978 | 27.6% |
| 11th Grade | 856 | 24.1% |
| 12th Grade | 753 | 21.2% |
Graduates Information (2010)
Graduation Rate
School:
85.5%
District:
80.3%
State:
78.6%
Teacher Education Background (2009)
Percent With Ph.D.
School:
78.1%
District:
1.8%
Percent With Master's Degree
School:
27.3%
District:
38.7%
Percent With Bachelor's Degree
School:
17.2%
District:
90.1%
Teacher Credentials & Experience (2009)
Percent of Teachers With Emergency Credentials: 5.2%
Percent of Teachers With Credentials: 91.4%
Number of Certificated Staff: 128.0
Average Number of Years of Teacher Experience: 17.5
Average Age
School:
43.8
District:
46.5
Source: CA Department of Education, Source: NCES 2009-2010
Sponsored Links
Test Scores and Performance Information
Overall School Rating
How is this determined?
The overall school rating shows that Schurr High School performed on average about the same as other schools across the state on CST state exams in the following subjects:
- CST Algebra I
- CST Algebra II
- CST Biology
- CST Chemistry
- CST Earth Science
- CST English-Language Arts
- CST Geometry
- CST Integrated/Coordinated Science
- CST Science
- CST Summative High School Math
- CST U.S. History
- CST World History
AYP Results (2010)
Overall AYP Met: No
ELA AYP Met: No
Math AYP Met: No
ACT Exam Results (2009)
Percent of Students Taking ACT Exam: 5.4%
Average Combined Score: 19.5
Percent Scoring At or Above 21: 40.5%
SAT Exam Results (2009)
Percent of Students Taking SAT Exam: 28.5%
Average Combined Score: 1,437.1
Critical Reading Average: 478.0
Math Average: 494.1
Writing Average: 465.1
Percent Scoring At or Above 1500: 38.0%
CST - Test Proficiency by Grade and Subject
Grade 9 - % of students at or above proficiency
| School | District | State | |
|---|---|---|---|
| CST Algebra I Test | |||
| 2010 | 26.0% | 18.0% | 22.0% |
| 2009 | 22.0% | 13.0% | 21.0% |
| 2008 | 11.0% | 10.0% | 18.0% |
| CST Algebra II Test | |||
| 2010 | 86.0% | 76.0% | 69.0% |
| 2009 | 71.0% | 67.0% | 65.0% |
| 2008 | 75.0% | 54.0% | 66.0% |
| CST Biology Test | |||
| 2010 | 93.0% | 56.0% | 55.0% |
| 2009 | 77.0% | 44.0% | 51.0% |
| 2008 | 79.0% | 45.0% | 52.0% |
| CST Chemistry Test | |||
| 2010 | 93.0% | 93.0% | 49.0% |
| 2009 | 64.0% | 64.0% | 44.0% |
| 2008 | 59.0% | 59.0% | 44.0% |
| CST English-Language Arts Test | |||
| 2010 | 51.0% | 43.0% | 54.0% |
| 2009 | 46.0% | 37.0% | 50.0% |
| 2008 | 45.0% | 36.0% | 49.0% |
| CST Geometry Test | |||
| 2010 | 53.0% | 33.0% | 46.0% |
| 2009 | 43.0% | 35.0% | 47.0% |
| 2008 | 36.0% | 27.0% | 43.0% |
| CST Integrated/Coordinated Science Test | |||
| 2010 | 20.0% | 19.0% | 19.0% |
| 2009 | 8.0% | 11.0% | 15.0% |
| 2008 | 11.0% | 4.0% | 5.0% |
Grade 10 - % of students at or above proficiency
| School | District | State | |
|---|---|---|---|
| CST Algebra I Test | |||
| 2010 | 8.0% | 6.0% | 12.0% |
| 2009 | 9.0% | 5.0% | 11.0% |
| 2008 | 7.0% | 4.0% | 9.0% |
| CST Algebra II Test | |||
| 2010 | 36.0% | 33.0% | 40.0% |
| 2009 | 38.0% | 27.0% | 37.0% |
| 2008 | 34.0% | 30.0% | 36.0% |
| CST Biology Test | |||
| 2010 | 51.0% | 35.0% | 38.0% |
| 2009 | 55.0% | 32.0% | 34.0% |
| 2008 | 61.0% | 31.0% | 35.0% |
| CST Chemistry Test | |||
| 2010 | 63.0% | 36.0% | 47.0% |
| 2009 | 60.0% | 37.0% | 44.0% |
| 2008 | 22.0% | 10.0% | 41.0% |
| CST English-Language Arts Test | |||
| 2010 | 38.0% | 31.0% | 45.0% |
| 2009 | 42.0% | 32.0% | 44.0% |
| 2008 | 34.0% | 26.0% | 41.0% |
| CST Geometry Test | |||
| 2010 | 18.0% | 10.0% | 14.0% |
| 2009 | 17.0% | 10.0% | 14.0% |
| 2008 | 12.0% | 7.0% | 12.0% |
| CST Integrated/Coordinated Science Test | |||
| 2010 | 1.0% | 14.0% | 14.0% |
| 2009 | 3.0% | 11.0% | 9.0% |
| 2008 | 2.0% | 10.0% | 7.0% |
| CST Science Test | |||
| 2010 | 37.0% | 31.0% | 46.0% |
| 2009 | 34.0% | 30.0% | 44.0% |
| 2008 | 34.0% | 26.0% | 40.0% |
| CST Summative High School Math Test | |||
| 2010 | 64.0% | 64.0% | 75.0% |
| 2009 | 72.0% | 73.0% | 71.0% |
| 2008 | 62.0% | 55.0% | 68.0% |
| CST World History Test | |||
| 2010 | 28.0% | 22.0% | 42.0% |
| 2009 | 28.0% | 23.0% | 38.0% |
| 2008 | 20.0% | 16.0% | 33.0% |
Grade 11 - % of students at or above proficiency
| School | District | State | |
|---|---|---|---|
| CST Algebra I Test | |||
| 2010 | 3.0% | 4.0% | 8.0% |
| 2009 | 5.0% | 4.0% | 8.0% |
| 2008 | 8.0% | 4.0% | 5.0% |
| CST Algebra II Test | |||
| 2010 | 17.0% | 9.0% | 14.0% |
| 2009 | 25.0% | 14.0% | 12.0% |
| 2008 | 17.0% | 13.0% | 11.0% |
| CST Biology Test | |||
| 2010 | 56.0% | 32.0% | 46.0% |
| 2009 | 35.0% | 23.0% | 41.0% |
| 2008 | 39.0% | 26.0% | 39.0% |
| CST Chemistry Test | |||
| 2010 | 31.0% | 23.0% | 30.0% |
| 2009 | 35.0% | 24.0% | 27.0% |
| 2008 | 28.0% | 16.0% | 25.0% |
| CST Earth Science Test | |||
| 2010 | 28.0% | 30.0% | 32.0% |
| 2009 | 18.0% | 21.0% | 26.0% |
| 2008 | 21.0% | 24.0% | 28.0% |
| CST English-Language Arts Test | |||
| 2010 | 35.0% | 29.0% | 42.0% |
| 2009 | 36.0% | 28.0% | 40.0% |
| 2008 | 34.0% | 24.0% | 37.0% |
| CST Geometry Test | |||
| 2010 | 4.0% | 3.0% | 6.0% |
| 2009 | 8.0% | 5.0% | 7.0% |
| 2008 | 9.0% | 4.0% | 6.0% |
| CST Integrated/Coordinated Science Test | |||
| 2010 | 2.0% | 2.0% | 8.0% |
| 2009 | - | - | - |
| 2008 | 1.0% | 1.0% | 10.0% |
| CST Summative High School Math Test | |||
| 2010 | 54.0% | 47.0% | 50.0% |
| 2009 | 58.0% | 45.0% | 47.0% |
| 2008 | 49.0% | 38.0% | 43.0% |
| CST U.S. History Test | |||
| 2010 | 40.0% | 31.0% | 45.0% |
| 2009 | 34.0% | 27.0% | 44.0% |
| 2008 | 30.0% | 24.0% | 38.0% |
End of Course - % of students at or above proficiency
| School | District | State | |
|---|---|---|---|
| CST Algebra I Test | |||
| 2010 | 17.0% | 23.0% | 31.0% |
| 2009 | 16.0% | 21.0% | 28.0% |
| 2008 | 9.0% | 16.0% | 25.0% |
| CST Algebra II Test | |||
| 2010 | 36.0% | 24.0% | 31.0% |
| 2009 | 36.0% | 23.0% | 28.0% |
| 2008 | 36.0% | 27.0% | 27.0% |
| CST Biology Test | |||
| 2010 | 57.0% | 38.0% | 46.0% |
| 2009 | 51.0% | 30.0% | 42.0% |
| 2008 | 57.0% | 32.0% | 42.0% |
| CST Chemistry Test | |||
| 2010 | 49.0% | 33.0% | 38.0% |
| 2009 | 45.0% | 32.0% | 36.0% |
| 2008 | 34.0% | 18.0% | 32.0% |
| CST Earth Science Test | |||
| 2010 | 27.0% | 21.0% | 33.0% |
| 2009 | 17.0% | 16.0% | 28.0% |
| 2008 | 20.0% | 17.0% | 28.0% |
| CST Geometry Test | |||
| 2010 | 20.0% | 16.0% | 27.0% |
| 2009 | 19.0% | 17.0% | 26.0% |
| 2008 | 17.0% | 12.0% | 24.0% |
| CST Integrated/Coordinated Science Test | |||
| 2010 | 1.0% | 18.0% | 16.0% |
| 2009 | 7.0% | 10.0% | 13.0% |
| 2008 | 8.0% | 9.0% | 11.0% |
| CST Summative High School Math Test | |||
| 2010 | 57.0% | 51.0% | 54.0% |
| 2009 | 63.0% | 53.0% | 50.0% |
| 2008 | 54.0% | 43.0% | 47.0% |
| CST World History Test | |||
| 2010 | 28.0% | 22.0% | 41.0% |
| 2009 | 28.0% | 23.0% | 38.0% |
| 2008 | 20.0% | 16.0% | 33.0% |
Source: CA Department of Education 2009-2010
School Map and Similar Schools Nearby
Click to Activate Map of Nearby School Campuses
Private
Public
This School
Similar Schools Nearby
| Montebello High School 9-12 | 3,491 Students | 1.0 miles away | ![]() 4.5 out of 5 | |
| James A. Garfield High School 9-12 | 4,271 Students | 1.9 miles away | ![]() 5 out of 5 | |
| El Rancho High School 9-12 | 3,191 Students | 3.8 miles away | ![]() 5 out of 5 | |
| Bell Gardens High School 9-12 | 3,570 Students | 4.1 miles away | Not Yet Rated | |
| Woodrow Wilson High School 9-12 | 2,457 Students | 4.5 miles away | Not Yet Rated | |
| Pioneer High School 9-12 | 1,492 Students | 4.8 miles away | Not Yet Rated | |
| Maywood Academy High 9-12 | 1,343 Students | 4.9 miles away | ![]() 5 out of 5 | |
| Theodore Roosevelt High School 9-12 | 3,819 Students | 5.0 miles away | ![]() 2.5 out of 5 | |
| Bell High School 9-12 | 4,301 Students | 5.4 miles away | ![]() 4.5 out of 5 | |
| Abraham Lincoln High School 9-12 | 2,632 Students | 5.4 miles away | ![]() 5 out of 5 | |
Compare This School To Nearby Schools ->
School Community Forum

Join a discussion about Schurr High School and talk to others in the community including students, parents, teachers, and administrators.
Popular Discussion Topics
- Admissions and Registration Questions (e.g. Dress Code and Discipline Policy)
- School Calendar and Upcoming Events (e.g. Graduation)
- After School Programs, Extracurricular Activities, and Athletics (e.g. Football)
- News and Announcements (e.g. Yearbook and Class Supply List Details)
- Graduate and Alumni Events (e.g. Organizing Class Reunions)
Navigation
Can't Find What You Are Looking For?
Rankings
Nearby Cities
Sponsored Links
K-12 Articles
What to Do when Your Child Hates School
All kids grumble about going to school at one time or another. This is perfectly normal, but what...
School Lunches ... Hot or Cold?
First there were four, now there are six, no one knows how many more there may be in the future....
Feeling Good in Your Own Skin
Body image is a very touchy issue with today's kids. Since the 1950s, when Barbie was first...


(5 / 5) 

