Joshua Tree Elementary School
Rating
Not Available
Not Available

5 out of 5 | 1 Review
Find Old Friends From Joshua Tree Elementary School
Use the form below to search for alumni from Joshua Tree Elementary School.
School Description
School Summary and Highlights
- Enrolls 373 elementary school students from grades KG-6
- Ranks 3311th out of 5,423 elementary schools in CA.
- 2010 Overall School AYP Met Status: Yes
Additional Contact Information
- Mailing Address: PO Box 1209, Twentynine Palms, CA 92277
School Operational Details
- Title I EligibleAll students of this school are eligible for participation in authorized programs.
School District Details
- Morongo Unified School District
- Per-Pupil Spending: $8,819
- Graduation Rate: 70.5%
- Dropout Rate: 4.4%
- Students Per Teacher: 21.8
- Enrolled Students: 9,525
Faculty Details and Student Enrollment
Students and Faculty
- Total Students Enrolled: 373
- Total Full Time "Equivalent" Teachers: 20.0
- Average Student-To-Teacher Ratio: 18.7
Students Gender Breakdown
- Males: 189 (50.7%)
- Females: 184 (49.3%)
Free Lunch Student Eligibility Breakdown
- Eligible for Reduced Lunch: 37 (9.9%)
- Eligible for Free Lunch: 267 (71.6%)
- Eligible for Either Reduced or Free Lunch: 304 (81.5%)
Student Enrollment Distribution by Race / Ethnicity
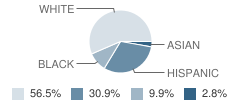
| Number | Percent | |
|---|---|---|
| American Indian | - | - |
| Black | 32 | 8.6% |
| Asian | 9 | 2.4% |
| Hispanic | 100 | 26.8% |
| White | 183 | 49.1% |
Number of Students Per Grade
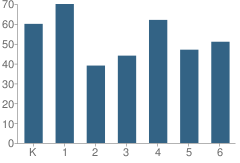
| Number | Percent | |
|---|---|---|
| Kindergarten | 60 | 16.1% |
| 1st Grade | 70 | 18.8% |
| 2nd Grade | 39 | 10.5% |
| 3rd Grade | 44 | 11.8% |
| 4th Grade | 62 | 16.6% |
| 5th Grade | 47 | 12.6% |
| 6th Grade | 51 | 13.7% |
Teacher Education Background (2009)
Percent With Master's Degree
School:
25.0%
District:
46.2%
Percent With Bachelor's Degree
School:
20.8%
District:
7.7%
Teacher Credentials & Experience (2009)
Percent of Teachers With Credentials: 100.0%
Number of Certificated Staff: 24.0
Average Number of Years of Teacher Experience: 10.7
Average Age
School:
46.3
District:
47.7
Source: CA Department of Education, Source: NCES 2009-2010
School Ratings and Reviews
Overall Rating: 5

5 out of 5 | 1 Review
The Overall Rating is the school's average rating from parents, students, school faculty and staff. The highest rating is five apples and the lowest is one apple.
Share Your Review About This School
1 review for Joshua Tree Elementary School
- Reviewed by Student on April 20, 2007
- Rating:
 (5 / 5) Flag as inappropriate
 - this is the BEST school I've EVER been to,but it is also the only school I have been to.there are great teachers,staff,and a great principal.I love this school and if I were you,I would want my kid to go there.
School Map and Similar Schools Nearby
Click to Activate Map of Nearby School Campuses
Private
Public
This School
Similar Schools Nearby
| Friendly Hills Elementary School KG-8 | 430 Students | 1.7 miles away | Not Yet Rated | |
| Yucca Mesa Elementary School KG-8 | 503 Students | 5.6 miles away |  4.5 out of 5 | |
| Yucca Valley Elementary School KG-6 | 575 Students | 8.4 miles away |  5 out of 5 | |
| Onaga Elementary School KG-6 | 809 Students | 8.6 miles away | 5 out of 5 | |
| Landers Elementary School KG-6 | 198 Students | 11.1 miles away |  1 out of 5 | |
| Oasis Elementary School KG-6 | 629 Students | 13.9 miles away | Not Yet Rated | |
| Palm Vista Elementary School KG-6 | 446 Students | 15.3 miles away | 5 out of 5 | |
| Twentynine Palms Elementary School KG-6 | 690 Students | 15.4 miles away |  3 out of 5 | |
| Condor Elementary School KG-6 | 546 Students | 15.7 miles away |  1.5 out of 5 | |
| Julius Corsini Elementary School KG-5 | 518 Students | 16.0 miles away | 5 out of 5 | |
Compare This School To Nearby Schools ->
School Community Forum

Join a discussion about Joshua Tree Elementary School and talk to others in the community including students, parents, teachers, and administrators.
Popular Discussion Topics
- Admissions and Registration Questions (e.g. Dress Code and Discipline Policy)
- School Calendar and Upcoming Events (e.g. Graduation)
- After School Programs, Extracurricular Activities, and Athletics (e.g. Football)
- News and Announcements (e.g. Yearbook and Class Supply List Details)
- Graduate and Alumni Events (e.g. Organizing Class Reunions)
Navigation
Can't Find What You Are Looking For?
Rankings
Nearby Cities
Sponsored Links
K-12 Articles

Breakfast, Kids and Learning
For generations parents have been telling their kids that breakfast is the most important meal of...
For generations parents have been telling their kids that breakfast is the most important meal of...

Keep Morning Stress at a Minimum: Establish a Routine
Morning! It can be a time of stress. The kids are fighting over who gets to use the bathroom first,...
Morning! It can be a time of stress. The kids are fighting over who gets to use the bathroom first,...

The Importance of Reading for Children Preschool to Grade Three
The first teachers of children are their parents. From the time they are infants, children need to...
The first teachers of children are their parents. From the time they are infants, children need to...