Yucca Valley High School

5 out of 5 | 1 Review
Find Old Friends From Yucca Valley High School
Use the form below to search for alumni from Yucca Valley High School.
School Description
School Summary and Highlights
- Enrolls 1,603 high school students from grades 9-12
- Ranks 693rd out of 1,197 high schools in CA.
- 2010 Overall School AYP Met Status: No
Additional Contact Information
- Mailing Address: PO Box 1209, Twentynine Palms, CA 92277
School District Details
- Morongo Unified School District
- Per-Pupil Spending: $8,819
- Graduation Rate: 70.5%
- Dropout Rate: 4.4%
- Students Per Teacher: 21.8
- Enrolled Students: 9,525
Faculty Details and Student Enrollment
Students and Faculty
- Total Students Enrolled: 1,603
- Total Full Time "Equivalent" Teachers: 66.0
- Average Student-To-Teacher Ratio: 24.3
Students Gender Breakdown
- Males: 808 (50.4%)
- Females: 795 (49.6%)
Free Lunch Student Eligibility Breakdown
- Eligible for Reduced Lunch: 136 (8.5%)
- Eligible for Free Lunch: 698 (43.5%)
- Eligible for Either Reduced or Free Lunch: 834 (52.0%)
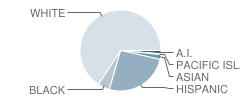
Student Enrollment Distribution by Race / Ethnicity

| Number | Percent | |
|---|---|---|
| American Indian | 23 | 1.4% |
| Black | 76 | 4.7% |
| Asian | 32 | 2.0% |
| Hispanic | 410 | 25.6% |
| White | 1,037 | 64.7% |
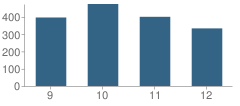
Number of Students Per Grade

| Number | Percent | |
|---|---|---|
| 9th Grade | 396 | 24.7% |
| 10th Grade | 474 | 29.6% |
| 11th Grade | 400 | 25.0% |
| 12th Grade | 333 | 20.8% |
Graduates Information (2010)
Graduation Rate
School:
81.2%
District:
83.2%
State:
78.6%
Teacher Education Background (2009)
Percent With Master's Degree
School:
36.6%
District:
46.2%
Percent With Bachelor's Degree
School:
23.2%
District:
7.7%
Teacher Credentials & Experience (2009)
Percent of Teachers With Credentials: 90.4%
Number of Certificated Staff: 82.0
Average Number of Years of Teacher Experience: 12.7
Average Age
School:
44.8
District:
47.7
Source: CA Department of Education, Source: NCES 2009-2010
Sponsored Links
Test Scores and Performance Information
Overall School Rating
How is this determined?
The overall school rating shows that Yucca Valley High School performed on average about the same as other schools across the state on CST state exams in the following subjects:
- CST Algebra I
- CST Algebra II
- CST Biology
- CST Chemistry
- CST Earth Science
- CST English-Language Arts
- CST General Mathematics
- CST Geometry
- CST Physics
- CST Science
- CST Summative High School Math
- CST U.S. History
- CST World History
AYP Results (2010)
Overall AYP Met: No
ELA AYP Met: No
Math AYP Met: No
ACT Exam Results (2009)
Percent of Students Taking ACT Exam: 4.3%
Average Combined Score: 25.9
Percent Scoring At or Above 21: 86.7%
SAT Exam Results (2009)
Percent of Students Taking SAT Exam: 14.9%
Average Combined Score: 1,521.9
Critical Reading Average: 506.7
Math Average: 512.7
Writing Average: 502.5
Percent Scoring At or Above 1500: 53.9%
CST - Test Proficiency by Grade and Subject
Grade 9 - % of students at or above proficiency
| School | District | State | |
|---|---|---|---|
| CST Algebra I Test | |||
| 2010 | 13.0% | 20.0% | 22.0% |
| 2009 | 41.0% | 34.0% | 21.0% |
| 2008 | 23.0% | 19.0% | 18.0% |
| CST Algebra II Test | |||
| 2010 | 35.0% | 42.0% | 69.0% |
| 2009 | 62.0% | 68.0% | 65.0% |
| CST Biology Test | |||
| 2010 | 46.0% | 51.0% | 55.0% |
| 2009 | 57.0% | 61.0% | 51.0% |
| 2008 | 53.0% | 59.0% | 52.0% |
| CST Earth Science Test | |||
| 2010 | 16.0% | 20.0% | 35.0% |
| 2009 | 13.0% | 19.0% | 29.0% |
| 2008 | 17.0% | 19.0% | 31.0% |
| CST English-Language Arts Test | |||
| 2010 | 51.0% | 51.0% | 54.0% |
| 2009 | 54.0% | 54.0% | 50.0% |
| 2008 | 52.0% | 51.0% | 49.0% |
| CST General Mathematics Test | |||
| 2010 | 3.0% | 2.0% | 17.0% |
| 2009 | 22.0% | 22.0% | 17.0% |
| 2008 | 33.0% | 32.0% | 18.0% |
| CST Geometry Test | |||
| 2010 | 44.0% | 44.0% | 46.0% |
| 2009 | 40.0% | 40.0% | 47.0% |
| 2008 | 50.0% | 56.0% | 43.0% |
Grade 10 - % of students at or above proficiency
| School | District | State | |
|---|---|---|---|
| CST Algebra I Test | |||
| 2010 | 10.0% | 11.0% | 12.0% |
| 2009 | 12.0% | 10.0% | 11.0% |
| 2008 | 21.0% | 17.0% | 9.0% |
| CST Algebra II Test | |||
| 2010 | 24.0% | 28.0% | 40.0% |
| 2009 | 40.0% | 43.0% | 37.0% |
| 2008 | 42.0% | 38.0% | 36.0% |
| CST Biology Test | |||
| 2010 | 29.0% | 37.0% | 38.0% |
| 2009 | 28.0% | 34.0% | 34.0% |
| 2008 | 32.0% | 36.0% | 35.0% |
| CST Chemistry Test | |||
| 2010 | 62.0% | 66.0% | 47.0% |
| 2009 | 58.0% | 59.0% | 44.0% |
| 2008 | 52.0% | 38.0% | 41.0% |
| CST Earth Science Test | |||
| 2010 | 34.0% | 26.0% | 29.0% |
| 2009 | 26.0% | 34.0% | 23.0% |
| 2008 | 33.0% | 28.0% | 23.0% |
| CST English-Language Arts Test | |||
| 2010 | 40.0% | 40.0% | 45.0% |
| 2009 | 39.0% | 41.0% | 44.0% |
| 2008 | 38.0% | 37.0% | 41.0% |
| CST Geometry Test | |||
| 2010 | 13.0% | 10.0% | 14.0% |
| 2009 | 17.0% | 14.0% | 14.0% |
| 2008 | 23.0% | 14.0% | 12.0% |
| CST Science Test | |||
| 2010 | 41.0% | 40.0% | 46.0% |
| 2009 | 41.0% | 41.0% | 44.0% |
| 2008 | 37.0% | 35.0% | 40.0% |
| CST Summative High School Math Test | |||
| 2010 | 74.0% | 72.0% | 75.0% |
| CST World History Test | |||
| 2010 | 30.0% | 33.0% | 42.0% |
| 2009 | 26.0% | 30.0% | 38.0% |
| 2008 | 24.0% | 26.0% | 33.0% |
Grade 11 - % of students at or above proficiency
| School | District | State | |
|---|---|---|---|
| CST Algebra I Test | |||
| 2010 | 3.0% | 6.0% | 8.0% |
| 2009 | 31.0% | 23.0% | 8.0% |
| 2008 | 10.0% | 6.0% | 5.0% |
| CST Algebra II Test | |||
| 2010 | 26.0% | 20.0% | 14.0% |
| 2009 | 16.0% | 10.0% | 12.0% |
| 2008 | 11.0% | 9.0% | 11.0% |
| CST Biology Test | |||
| 2010 | 38.0% | 70.0% | 46.0% |
| 2009 | 44.0% | 66.0% | 41.0% |
| 2008 | 39.0% | 54.0% | 39.0% |
| CST Chemistry Test | |||
| 2010 | 46.0% | 46.0% | 30.0% |
| 2009 | 48.0% | 33.0% | 27.0% |
| 2008 | 33.0% | 23.0% | 25.0% |
| CST Earth Science Test | |||
| 2010 | 24.0% | 30.0% | 32.0% |
| 2009 | 27.0% | 34.0% | 26.0% |
| 2008 | 10.0% | 30.0% | 28.0% |
| CST English-Language Arts Test | |||
| 2010 | 44.0% | 40.0% | 42.0% |
| 2009 | 40.0% | 36.0% | 40.0% |
| 2008 | 34.0% | 34.0% | 37.0% |
| CST Geometry Test | |||
| 2010 | 14.0% | 10.0% | 6.0% |
| 2009 | 24.0% | 19.0% | 7.0% |
| 2008 | 13.0% | 10.0% | 6.0% |
| CST Physics Test | |||
| 2010 | 81.0% | 81.0% | 53.0% |
| CST Summative High School Math Test | |||
| 2010 | 40.0% | 47.0% | 50.0% |
| 2009 | 61.0% | 53.0% | 47.0% |
| 2008 | 39.0% | 46.0% | 43.0% |
| CST U.S. History Test | |||
| 2010 | 41.0% | 40.0% | 45.0% |
| 2009 | 42.0% | 38.0% | 44.0% |
| 2008 | 32.0% | 30.0% | 38.0% |
| CST World History Test | |||
| 2010 | 13.0% | 9.0% | 15.0% |
| 2009 | 19.0% | 20.0% | 11.0% |
| 2008 | 7.0% | 10.0% | 9.0% |
End of Course - % of students at or above proficiency
| School | District | State | |
|---|---|---|---|
| CST Algebra I Test | |||
| 2010 | 11.0% | 26.0% | 31.0% |
| 2009 | 29.0% | 34.0% | 28.0% |
| 2008 | 20.0% | 22.0% | 25.0% |
| CST Algebra II Test | |||
| 2010 | 26.0% | 28.0% | 31.0% |
| 2009 | 36.0% | 36.0% | 28.0% |
| 2008 | 28.0% | 22.0% | 27.0% |
| CST Biology Test | |||
| 2010 | 41.0% | 50.0% | 46.0% |
| 2009 | 51.0% | 56.0% | 42.0% |
| 2008 | 45.0% | 50.0% | 42.0% |
| CST Chemistry Test | |||
| 2010 | 57.0% | 59.0% | 38.0% |
| 2009 | 54.0% | 50.0% | 36.0% |
| 2008 | 43.0% | 30.0% | 32.0% |
| CST Earth Science Test | |||
| 2010 | 22.0% | 24.0% | 33.0% |
| 2009 | 16.0% | 24.0% | 28.0% |
| 2008 | 19.0% | 23.0% | 28.0% |
| CST General Mathematics Test | |||
| 2010 | 3.0% | 26.0% | 27.0% |
| 2009 | 22.0% | 24.0% | 26.0% |
| 2008 | 33.0% | 31.0% | 27.0% |
| CST Geometry Test | |||
| 2010 | 21.0% | 22.0% | 27.0% |
| 2009 | 25.0% | 25.0% | 26.0% |
| 2008 | 27.0% | 28.0% | 24.0% |
| CST Physics Test | |||
| 2010 | 82.0% | 82.0% | 49.0% |
| CST Summative High School Math Test | |||
| 2010 | 49.0% | 55.0% | 54.0% |
| 2009 | 62.0% | 55.0% | 50.0% |
| 2008 | 39.0% | 48.0% | 47.0% |
| CST World History Test | |||
| 2010 | 28.0% | 32.0% | 41.0% |
| 2009 | 26.0% | 30.0% | 38.0% |
| 2008 | 23.0% | 25.0% | 33.0% |
Source: CA Department of Education 2009-2010
School Map and Similar Schools Nearby
Click to Activate Map of Nearby School Campuses
Private
Public
This School
Similar Schools Nearby
| La Contenta Junior High School 7-8 | 871 Students | 3.1 miles away | Not Yet Rated | |
| Desert Hot Springs High School 9-12 | 1,935 Students | 11.7 miles away | ![]() 3 out of 5 | |
| Twentynine Palms High School 9-12 | 856 Students | 20.1 miles away | ![]() 3.5 out of 5 | |
| Palm Springs High School 9-12 | 2,158 Students | 21.1 miles away | Not Yet Rated | |
| Cathedral City High School 9-12 | 2,849 Students | 21.7 miles away | Not Yet Rated | |
| Twentynine Palms Junior High School 7-8 | 525 Students | 22.2 miles away | ![]() 1 out of 5 | |
| Big Bear High School 9-12 | 893 Students | 24.8 miles away | ![]() 5 out of 5 | |
| Palm Desert High School 9-12 | 2,103 Students | 26.7 miles away | Not Yet Rated | |
| Banning High School 9-12 | 1,170 Students | 29.4 miles away | Not Yet Rated | |
Compare This School To Nearby Schools ->
School Community Forum

Join a discussion about Yucca Valley High School and talk to others in the community including students, parents, teachers, and administrators.
Popular Discussion Topics
- Admissions and Registration Questions (e.g. Dress Code and Discipline Policy)
- School Calendar and Upcoming Events (e.g. Graduation)
- After School Programs, Extracurricular Activities, and Athletics (e.g. Football)
- News and Announcements (e.g. Yearbook and Class Supply List Details)
- Graduate and Alumni Events (e.g. Organizing Class Reunions)
Navigation
Can't Find What You Are Looking For?
Rankings
Nearby Cities
Sponsored Links
K-12 Articles
Where in the World is Carmen Sandiego?
One of the sensations on YouTube highlights the state of our education system. The spot was...
Promoting Childhood Literacy
The number of American adults who are illiterate is astounding. People who lack the ability to read...
Cut the Credit and Save You Some Money
Today's society glorifies a get-it-now mentality. Children learn this early. You probably noticed...


(5 / 5) 


