Alfred S. Madrid Middle School
Rating
Not Available
Not Available

4 out of 5 | 4 Reviews
Find Old Friends From Alfred S. Madrid Middle School
Use the form below to search for alumni from Alfred S. Madrid Middle School.
School Description
School Summary and Highlights
- Enrolls 1,102 middle school students from grades 6-8
- Ranks 1727th out of 2,050 middle schools in CA.
- 2010 Overall School AYP Met Status: No
Additional Contact Information
- Mailing Address: 3300 Gilman Rd., El Monte, CA 91732
School Operational Details
- Title I Eligible
School District Details
- Mountain View Elementary School District
- Per-Pupil Spending: $10,416
- Students Per Teacher: 20.6
- Enrolled Students: 8,346
Faculty Details and Student Enrollment
Students and Faculty
- Total Students Enrolled: 1,102
- Total Full Time "Equivalent" Teachers: 53.0
- Average Student-To-Teacher Ratio: 20.8
Students Gender Breakdown
- Males: 548 (49.7%)
- Females: 554 (50.3%)
Free Lunch Student Eligibility Breakdown
- Eligible for Reduced Lunch: 122 (11.1%)
- Eligible for Free Lunch: 929 (84.3%)
- Eligible for Either Reduced or Free Lunch: 1,051 (95.4%)
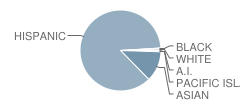
Student Enrollment Distribution by Race / Ethnicity
| Number | Percent | |
|---|---|---|
| American Indian | 5 | 0.5% |
| Black | 3 | 0.3% |
| Asian | 134 | 12.2% |
| Hispanic | 949 | 86.1% |
| White | 9 | 0.8% |
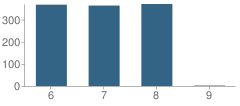
Number of Students Per Grade
| Number | Percent | |
|---|---|---|
| 6th Grade | 367 | 33.3% |
| 7th Grade | 363 | 32.9% |
| 8th Grade | 370 | 33.6% |
| 9th Grade | 2 | 0.2% |
Teacher Education Background (2009)
Percent With Master's Degree
School:
26.3%
District:
29.0%
Percent With Bachelor's Degree: 5.3%
Teacher Credentials & Experience (2009)
Percent of Teachers With Credentials: 100.0%
Number of Certificated Staff: 57.0
Average Number of Years of Teacher Experience: 16.4
Average Age
School:
43.3
District:
44.0
Source: CA Department of Education, Source: NCES 2009-2010
School Ratings and Reviews
Overall Rating: 4

4 out of 5 | 4 Reviews
The Overall Rating is the school's average rating from parents, students, school faculty and staff. The highest rating is five apples and the lowest is one apple.
Share Your Review About This School
4 reviews for Alfred S. Madrid Middle School
- Reviewed by Parent/Guardian on July 12, 2010
- Rating:
 (1 / 5) Flag as inappropriate
 - suck because people bring drug to school
- Reviewed by Parent/Guardian on March 07, 2010
- Rating:
 (5 / 5) Flag as inappropriate
 - Alfred S Madrid middle school
- Reviewed by Parent/Guardian on October 11, 2009
- Rating: (5 / 5) Flag as inappropriate
- madrid is awesome
- Reviewed by Community Member on September 19, 2009
- Rating: (5 / 5) Flag as inappropriate
- Madrid is a really nice school
School Map and Similar Schools Nearby
Click to Activate Map of Nearby School Campuses
Private
Public
This School
Similar Schools Nearby
| Willard F. Payne Elementary School KG-6 | 556 Students | 0.8 miles away |  2 out of 5 | |
| Parkview Elementary School KG-6 | 903 Students | 0.9 miles away |  5 out of 5 | |
| Maxson Elementary School KG-6 | 783 Students | 1.0 miles away | 5 out of 5 | |
| Charles T. Kranz Intermediate School 7-8 | 1,101 Students | 1.4 miles away | Not Yet Rated | |
| Durfee Elementary School KG-8 | 1,193 Students | 1.4 miles away | 5 out of 5 | |
| Cogswell Elementary School KG-6 | 571 Students | 1.5 miles away | 5 out of 5 | |
| Columbia Elementary School KG-8 | 907 Students | 1.5 miles away | 5 out of 5 | |
| Torch Middle School 6-8 | 762 Students | 1.5 miles away | Not Yet Rated | |
| Legore Elementary School KG-6 | 650 Students | 1.7 miles away | Not Yet Rated | |
| Wright Elementary School KG-8 | 983 Students | 1.8 miles away | 5 out of 5 | |
Compare This School To Nearby Schools ->
School Community Forum

Join a discussion about Alfred S. Madrid Middle School and talk to others in the community including students, parents, teachers, and administrators.
Popular Discussion Topics
- Admissions and Registration Questions (e.g. Dress Code and Discipline Policy)
- School Calendar and Upcoming Events (e.g. Graduation)
- After School Programs, Extracurricular Activities, and Athletics (e.g. Football)
- News and Announcements (e.g. Yearbook and Class Supply List Details)
- Graduate and Alumni Events (e.g. Organizing Class Reunions)
Navigation
Can't Find What You Are Looking For?
Rankings
Nearby Cities
Sponsored Links
K-12 Articles

School Lunches ... Hot or Cold?
First there were four, now there are six, no one knows how many more there may be in the future....
First there were four, now there are six, no one knows how many more there may be in the future....

Simple Math ... a Simple Gift
Math affects every aspect of our lives-from balancing the checkbook to estimating the amount of...
Math affects every aspect of our lives-from balancing the checkbook to estimating the amount of...

The First Day of School
The first day of kindergarten is a rite of passage for any student. Every mother cries and...
The first day of kindergarten is a rite of passage for any student. Every mother cries and...