Shore Acres Elementary School
Rating
Not Available
Not Available

No Reviews Yet
Find Old Friends From Shore Acres Elementary School
Use the form below to search for alumni from Shore Acres Elementary School.
School Description
School Summary and Highlights
- Enrolls 549 elementary school students from grades KG-5
- Ranks 5301st out of 5,423 elementary schools in CA.
- 2010 Overall School AYP Met Status: No
Additional Contact Information
- Mailing Address: 351 Marina Rd., Bay Point, CA 94565
School Operational Details
- Title I EligibleAll students of this school are eligible for participation in authorized programs.
School District Details
- Mt. Diablo Unified School District
- Per-Pupil Spending: $8,861
- Graduation Rate: 76.8%
- Dropout Rate: 6.2%
- Students Per Teacher: 22.7
- Enrolled Students: 34,154
Faculty Details and Student Enrollment
Students and Faculty
- Total Students Enrolled: 549
- Total Full Time "Equivalent" Teachers: 19.8
- Average Student-To-Teacher Ratio: 27.7
Students Gender Breakdown
- Males: 278 (50.6%)
- Females: 271 (49.4%)
Free Lunch Student Eligibility Breakdown
- Eligible for Reduced Lunch: 62 (11.3%)
- Eligible for Free Lunch: 410 (74.7%)
- Eligible for Either Reduced or Free Lunch: 472 (86.0%)
Student Enrollment Distribution by Race / Ethnicity
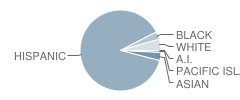
| Number | Percent | |
|---|---|---|
| American Indian | 1 | 0.2% |
| Black | 17 | 3.1% |
| Asian | 18 | 3.3% |
| Hispanic | 483 | 88.0% |
| White | 25 | 4.6% |
Number of Students Per Grade
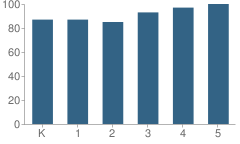
| Number | Percent | |
|---|---|---|
| Kindergarten | 87 | 15.8% |
| 1st Grade | 87 | 15.8% |
| 2nd Grade | 85 | 15.5% |
| 3rd Grade | 93 | 16.9% |
| 4th Grade | 97 | 17.7% |
| 5th Grade | 100 | 18.2% |
Teacher Education Background (2009)
Percent With Master's Degree
School:
20.0%
District:
61.7%
Teacher Credentials & Experience (2009)
Percent of Teachers With Credentials: 100.0%
Number of Certificated Staff: 30.0
Average Number of Years of Teacher Experience: 9.6
Average Age
School:
42.0
District:
48.8
Source: CA Department of Education, Source: NCES 2009-2010
School Ratings and Reviews
Be The First To Review Shore Acres Elementary School!
School Map and Similar Schools Nearby
Click to Activate Map of Nearby School Campuses
Private
Public
This School
Similar Schools Nearby
| Rio Vista Elementary School KG-5 | 427 Students | 0.3 miles away | Not Yet Rated | |
| Delta View Elementary School KG-5 | 674 Students | 1.6 miles away | Not Yet Rated | |
| Bel Air Elementary School KG-5 | 406 Students | 2.0 miles away | Not Yet Rated | |
| Willow Cove Elementary School KG-5 | 656 Students | 2.5 miles away | Not Yet Rated | |
| Monte Gardens Elementary School KG-5 | 572 Students | 3.8 miles away | Not Yet Rated | |
| Parkside Elementary School KG-5 | 581 Students | 3.9 miles away | Not Yet Rated | |
| Los Medanos Elementary School KG-5 | 655 Students | 4.0 miles away | Not Yet Rated | |
| Sun Terrace Elementary School KG-5 | 518 Students | 4.0 miles away | Not Yet Rated | |
| Holbrook Elementary School KG-5 | 432 Students | 4.2 miles away | Not Yet Rated | |
| Westwood Elementary School KG-5 | 380 Students | 4.2 miles away |  5 out of 5 | |
Compare This School To Nearby Schools ->
School Community Forum

Join a discussion about Shore Acres Elementary School and talk to others in the community including students, parents, teachers, and administrators.
Popular Discussion Topics
- Admissions and Registration Questions (e.g. Dress Code and Discipline Policy)
- School Calendar and Upcoming Events (e.g. Graduation)
- After School Programs, Extracurricular Activities, and Athletics (e.g. Football)
- News and Announcements (e.g. Yearbook and Class Supply List Details)
- Graduate and Alumni Events (e.g. Organizing Class Reunions)
Navigation
Can't Find What You Are Looking For?
Rankings
Nearby Cities
Sponsored Links
K-12 Articles

Teaching Your Kids About Respect, Values and Violence
These days it seems that every newscast reports at least once incident of violence. As parents, we...
These days it seems that every newscast reports at least once incident of violence. As parents, we...

Teaching Kids to Deal with Peer Pressure
Parents usually become very concerned when they hear the term "peer pressure." However, peer...
Parents usually become very concerned when they hear the term "peer pressure." However, peer...

The Pros and Cons of Seat Belts in School Buses
Recently the news has been full of school bus accidents where children have been seriously injured...
Recently the news has been full of school bus accidents where children have been seriously injured...