Desert High School

No Reviews Yet
Find Old Friends From Desert High School
Use the form below to search for alumni from Desert High School.
School Description
School Summary and Highlights
- Enrolls 622 middle and high school students from grades 7-12
- Ranks 240th out of 1,197 high schools in CA.
- 2010 Overall School AYP Met Status: No
Additional Contact Information
- Mailing Address: 1575 Payne Ave., Edwards, CA 93523
School District Details
- Muroc Joint Unified School District
- Per-Pupil Spending: $10,428
- Graduation Rate: 75.6%
- Dropout Rate: 3.3%
- Students Per Teacher: 20.6
- Enrolled Students: 2,049
Faculty Details and Student Enrollment
Students and Faculty
- Total Students Enrolled: 622
- Total Full Time "Equivalent" Teachers: 28.4
- Average Student-To-Teacher Ratio: 21.9
Students Gender Breakdown
- Males: 312 (50.2%)
- Females: 310 (49.8%)
Free Lunch Student Eligibility Breakdown
- Eligible for Reduced Lunch: 23 (3.7%)
- Eligible for Free Lunch: 18 (2.9%)
- Eligible for Either Reduced or Free Lunch: 41 (6.6%)
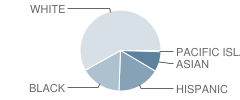
Student Enrollment Distribution by Race / Ethnicity

| Number | Percent | |
|---|---|---|
| American Indian | - | - |
| Black | 101 | 16.2% |
| Asian | 50 | 8.0% |
| Hispanic | 106 | 17.0% |
| White | 361 | 58.0% |
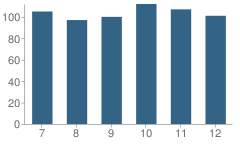
Number of Students Per Grade

| Number | Percent | |
|---|---|---|
| 7th Grade | 105 | 16.9% |
| 8th Grade | 97 | 15.6% |
| 9th Grade | 100 | 16.1% |
| 10th Grade | 112 | 18.0% |
| 11th Grade | 107 | 17.2% |
| 12th Grade | 101 | 16.2% |
Graduates Information (2010)
Graduation Rate
School:
96.3%
District:
90.2%
State:
78.6%
Teacher Education Background (2009)
Percent With Master's Degree
School:
15.6%
District:
28.6%
Percent With Bachelor's Degree
School:
21.9%
District:
14.3%
Teacher Credentials & Experience (2009)
Percent of Teachers With Credentials: 96.4%
Number of Certificated Staff: 32.0
Average Number of Years of Teacher Experience: 15.1
Average Age
School:
45.4
District:
53.6
Source: CA Department of Education, Source: NCES 2009-2010
School Ratings and Reviews
Be The First To Review Desert High School!
Sponsored Links
Test Scores and Performance Information
Overall School Rating
How is this determined?
The overall school rating shows that Desert High School performed on average better than many other schools across the state on CST state exams in the following subjects:
- CST Algebra I
- CST Algebra II
- CST Biology
- CST Chemistry
- CST Earth Science
- CST English-Language Arts
- CST General Mathematics
- CST Geometry
- CST History - Social Science
- CST Mathematics
- CST Science
- CST Summative High School Math
- CST U.S. History
- CST World History
AYP Results (2010)
Overall AYP Met: No
ELA AYP Met: Yes
Math AYP Met: No
ACT Exam Results (2009)
Percent of Students Taking ACT Exam: 7.7%
SAT Exam Results (2009)
Percent of Students Taking SAT Exam: 52.6%
Average Combined Score: 1,402.4
Critical Reading Average: 473.9
Math Average: 472.7
Writing Average: 455.9
Percent Scoring At or Above 1500: 43.9%
CST - Test Proficiency by Grade and Subject
Grade 7 - % of students at or above proficiency
| School | District | State | |
|---|---|---|---|
| CST English-Language Arts Test | |||
| 2010 | 66.0% | 57.0% | 55.0% |
| 2009 | 63.0% | 55.0% | 54.0% |
| CST Mathematics Test | |||
| 2010 | 45.0% | 40.0% | 48.0% |
| 2009 | 51.0% | 44.0% | 43.0% |
Grade 8 - % of students at or above proficiency
| School | District | State | |
|---|---|---|---|
| CST Algebra I Test | |||
| 2010 | 53.0% | 53.0% | 46.0% |
| 2009 | 97.0% | 69.0% | 44.0% |
| CST English-Language Arts Test | |||
| 2010 | 57.0% | 52.0% | 54.0% |
| 2009 | 65.0% | 54.0% | 48.0% |
| CST General Mathematics Test | |||
| 2010 | 31.0% | 21.0% | 30.0% |
| 2009 | 43.0% | 35.0% | 30.0% |
| CST History - Social Science Test | |||
| 2010 | 40.0% | 38.0% | 47.0% |
| 2009 | 51.0% | 50.0% | 42.0% |
| CST Science Test | |||
| 2010 | 72.0% | 66.0% | 59.0% |
| 2009 | 64.0% | 61.0% | 56.0% |
Grade 9 - % of students at or above proficiency
| School | District | State | |
|---|---|---|---|
| CST Algebra I Test | |||
| 2010 | 38.0% | 33.0% | 22.0% |
| 2009 | 36.0% | 29.0% | 21.0% |
| 2008 | 26.0% | 23.0% | 18.0% |
| CST Earth Science Test | |||
| 2010 | 55.0% | 52.0% | 35.0% |
| 2009 | 48.0% | 45.0% | 29.0% |
| 2008 | 42.0% | 40.0% | 31.0% |
| CST English-Language Arts Test | |||
| 2010 | 74.0% | 63.0% | 54.0% |
| 2009 | 79.0% | 68.0% | 50.0% |
| 2008 | 70.0% | 61.0% | 49.0% |
| CST General Mathematics Test | |||
| 2010 | 44.0% | 31.0% | 17.0% |
| 2009 | 56.0% | 40.0% | 17.0% |
| 2008 | 37.0% | 37.0% | 18.0% |
| CST Geometry Test | |||
| 2010 | 29.0% | 26.0% | 46.0% |
| 2009 | 36.0% | 40.0% | 47.0% |
| 2008 | 24.0% | 31.0% | 43.0% |
| CST Biology Test | |||
| 2008 | 95.0% | 60.0% | 52.0% |
Grade 10 - % of students at or above proficiency
| School | District | State | |
|---|---|---|---|
| CST Algebra I Test | |||
| 2010 | 15.0% | 13.0% | 12.0% |
| 2009 | 4.0% | 6.0% | 11.0% |
| 2008 | 16.0% | 13.0% | 9.0% |
| CST Algebra II Test | |||
| 2010 | 31.0% | 30.0% | 40.0% |
| 2009 | 30.0% | 37.0% | 37.0% |
| 2008 | 27.0% | 41.0% | 36.0% |
| CST Biology Test | |||
| 2010 | 69.0% | 63.0% | 38.0% |
| 2009 | 68.0% | 67.0% | 34.0% |
| 2008 | 56.0% | 52.0% | 35.0% |
| CST English-Language Arts Test | |||
| 2010 | 61.0% | 52.0% | 45.0% |
| 2009 | 57.0% | 50.0% | 44.0% |
| 2008 | 55.0% | 48.0% | 41.0% |
| CST Geometry Test | |||
| 2010 | 8.0% | 10.0% | 14.0% |
| 2009 | 9.0% | 12.0% | 14.0% |
| 2008 | 5.0% | 13.0% | 12.0% |
| CST Science Test | |||
| 2010 | 70.0% | 67.0% | 46.0% |
| 2009 | 69.0% | 62.0% | 44.0% |
| 2008 | 66.0% | 62.0% | 40.0% |
| CST World History Test | |||
| 2010 | 51.0% | 45.0% | 42.0% |
| 2009 | 46.0% | 42.0% | 38.0% |
| 2008 | 41.0% | 39.0% | 33.0% |
Grade 11 - % of students at or above proficiency
| School | District | State | |
|---|---|---|---|
| CST Algebra I Test | |||
| 2010 | 9.0% | 6.0% | 8.0% |
| 2009 | 8.0% | 10.0% | 8.0% |
| CST Algebra II Test | |||
| 2010 | 10.0% | 11.0% | 14.0% |
| 2009 | 8.0% | 9.0% | 12.0% |
| CST Biology Test | |||
| 2010 | 74.0% | 68.0% | 46.0% |
| 2009 | 66.0% | 64.0% | 41.0% |
| CST Chemistry Test | |||
| 2010 | 39.0% | 33.0% | 30.0% |
| 2009 | 28.0% | 28.0% | 27.0% |
| 2008 | 51.0% | 45.0% | 25.0% |
| CST English-Language Arts Test | |||
| 2010 | 53.0% | 47.0% | 42.0% |
| 2009 | 55.0% | 46.0% | 40.0% |
| 2008 | 46.0% | 42.0% | 37.0% |
| CST Summative High School Math Test | |||
| 2010 | 59.0% | 61.0% | 50.0% |
| 2009 | 34.0% | 39.0% | 47.0% |
| 2008 | 24.0% | 26.0% | 43.0% |
| CST U.S. History Test | |||
| 2010 | 57.0% | 49.0% | 45.0% |
| 2009 | 53.0% | 46.0% | 44.0% |
| 2008 | 49.0% | 44.0% | 38.0% |
| CST Geometry Test | |||
| 2009 | 4.0% | 3.0% | 7.0% |
End of Course - % of students at or above proficiency
| School | District | State | |
|---|---|---|---|
| CST Algebra I Test | |||
| 2010 | 36.0% | 33.0% | 31.0% |
| 2009 | 44.0% | 36.0% | 28.0% |
| 2008 | 20.0% | 25.0% | 25.0% |
| CST Algebra II Test | |||
| 2010 | 24.0% | 24.0% | 31.0% |
| 2009 | 19.0% | 23.0% | 28.0% |
| 2008 | 12.0% | 20.0% | 27.0% |
| CST Biology Test | |||
| 2010 | 71.0% | 64.0% | 46.0% |
| 2009 | 69.0% | 63.0% | 42.0% |
| 2008 | 61.0% | 55.0% | 42.0% |
| CST Chemistry Test | |||
| 2010 | 37.0% | 32.0% | 38.0% |
| 2009 | 29.0% | 29.0% | 36.0% |
| 2008 | 47.0% | 43.0% | 32.0% |
| CST Earth Science Test | |||
| 2010 | 51.0% | 46.0% | 33.0% |
| 2009 | 46.0% | 42.0% | 28.0% |
| 2008 | 42.0% | 39.0% | 28.0% |
| CST General Mathematics Test | |||
| 2010 | 36.0% | 25.0% | 27.0% |
| 2009 | 47.0% | 37.0% | 26.0% |
| 2008 | 37.0% | 32.0% | 27.0% |
| CST Geometry Test | |||
| 2010 | 15.0% | 15.0% | 27.0% |
| 2009 | 21.0% | 22.0% | 26.0% |
| 2008 | 10.0% | 19.0% | 24.0% |
| CST Summative High School Math Test | |||
| 2010 | 61.0% | 63.0% | 54.0% |
| 2009 | 37.0% | 42.0% | 50.0% |
| 2008 | 32.0% | 31.0% | 47.0% |
| CST World History Test | |||
| 2010 | 50.0% | 44.0% | 41.0% |
| 2009 | 46.0% | 41.0% | 38.0% |
| 2008 | 41.0% | 39.0% | 33.0% |
Source: CA Department of Education 2009-2010
School Map and Similar Schools Nearby
Click to Activate Map of Nearby School Campuses
Private
Public
This School
Similar Schools Nearby
| Rosamond High School 9-12 | 921 Students | 14.1 miles away | ![]() 3 out of 5 | |
| California City High School 9-12 | 390 Students | 14.9 miles away | Not Yet Rated | - |
| Mojave High School 7-12 | 410 Students | 15.3 miles away | ![]() 4 out of 5 | |
| Boron Junior-High School 7-12 | 233 Students | 17.7 miles away | Not Yet Rated | |
| Eastside High School 9-12 | 2,527 Students | 18.1 miles away | ![]() 3.5 out of 5 | |
| Antelope Valley High School 9-12 | 1,772 Students | 18.6 miles away | ![]() 4.5 out of 5 | |
| Lancaster High School 9-12 | 2,751 Students | 20.9 miles away | ![]() 3.5 out of 5 | |
| Littlerock High School 9-12 | 1,795 Students | 24.2 miles away | ![]() 5 out of 5 | |
| Quartz Hill High School 9-12 | 3,118 Students | 24.6 miles away | Not Yet Rated | |
| William J. 'pete' Knight High School 9-12 | 3,450 Students | 25.2 miles away | ![]() 5 out of 5 | |
Compare This School To Nearby Schools ->
School Community Forum

Join a discussion about Desert High School and talk to others in the community including students, parents, teachers, and administrators.
Popular Discussion Topics
- Admissions and Registration Questions (e.g. Dress Code and Discipline Policy)
- School Calendar and Upcoming Events (e.g. Graduation)
- After School Programs, Extracurricular Activities, and Athletics (e.g. Football)
- News and Announcements (e.g. Yearbook and Class Supply List Details)
- Graduate and Alumni Events (e.g. Organizing Class Reunions)
Navigation
Can't Find What You Are Looking For?
Rankings
Nearby Cities
Sponsored Links
K-12 Articles
Help Your Child Achieve Success in Middle School
Middle school is for children between the ages of 10 and 14 years. At this time children begin to...
Beating the Summer Slump
"The Summer Slump", teachers call it. It happens every year. It makes its way into lesson plans...
Teach Your Child to Write Well
When American children head off to junior kindergarten, they must be ready to learn. It is your...


