Napa Valley Language Academy
Rating
Not Available
Not Available

5 out of 5 | 1 Review
Find Old Friends From Napa Valley Language Academy
Use the form below to search for alumni from Napa Valley Language Academy.
School Description
School Summary and Highlights
- Enrolls 688 elementary school students from grades KG-6
- Ranks 2928th out of 5,423 elementary schools in CA.
- 2010 Overall School AYP Met Status: No
Additional Contact Information
- Mailing Address: 2700 Kilburn Ave., Napa, CA 94558
School Operational Details
- Title I EligibleAll students of this school are eligible for participation in authorized programs.
- Charter School
School District Details
- Napa Valley Unified School District
- Per-Pupil Spending: $8,474
- Graduation Rate: 73.7%
- Dropout Rate: 4.5%
- Students Per Teacher: 21.4
- Enrolled Students: 17,691
Faculty Details and Student Enrollment
Students and Faculty
- Total Students Enrolled: 688
- Total Full Time "Equivalent" Teachers: 30.3
- Average Student-To-Teacher Ratio: 22.7
Students Gender Breakdown
- Males: 313 (45.5%)
- Females: 375 (54.5%)
Free Lunch Student Eligibility Breakdown
- Eligible for Reduced Lunch: 92 (13.4%)
- Eligible for Free Lunch: 259 (37.6%)
- Eligible for Either Reduced or Free Lunch: 351 (51.0%)
Student Enrollment Distribution by Race / Ethnicity
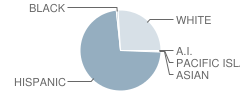
| Number | Percent | |
|---|---|---|
| American Indian | 1 | 0.1% |
| Black | 5 | 0.7% |
| Asian | 3 | 0.4% |
| Hispanic | 481 | 69.9% |
| White | 172 | 25.0% |
Number of Students Per Grade
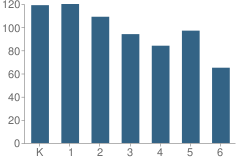
| Number | Percent | |
|---|---|---|
| Kindergarten | 119 | 17.3% |
| 1st Grade | 120 | 17.4% |
| 2nd Grade | 109 | 15.8% |
| 3rd Grade | 94 | 13.7% |
| 4th Grade | 84 | 12.2% |
| 5th Grade | 97 | 14.1% |
| 6th Grade | 65 | 9.4% |
Teacher Education Background (2009)
Percent With Ph.D.
School:
2.5%
District:
9.6%
Percent With Master's Degree
School:
20.0%
District:
48.1%
Percent With Bachelor's Degree
School:
10.0%
District:
7.7%
Teacher Credentials & Experience (2009)
Percent of Teachers With Credentials: 100.0%
Number of Certificated Staff: 40.0
Average Number of Years of Teacher Experience: 12.9
Average Age
School:
40.3
District:
51.9
Source: CA Department of Education, Source: NCES 2009-2010
School Ratings and Reviews
Overall Rating: 5

5 out of 5 | 1 Review
The Overall Rating is the school's average rating from parents, students, school faculty and staff. The highest rating is five apples and the lowest is one apple.
Share Your Review About This School
1 review for Napa Valley Language Academy
- Reviewed by Former Student on June 26, 2010
- Rating:
 (5 / 5) Flag as inappropriate
 - N.V.L.A. is an amzing school i loved it there!
School Map and Similar Schools Nearby
Click to Activate Map of Nearby School Campuses
Private
Public
This School
Similar Schools Nearby
| Shearer Charter School KG-5 | 553 Students | 0.9 miles away |  5 out of 5 | |
| Phillips-Edison Partnership School KG-6 | 586 Students | 2.4 miles away | Not Yet Rated | |
| Stone Bridge School KG-8 | 275 Students | 3.1 miles away | Not Yet Rated | |
| Vallejo Charter School KG-7 | 357 Students | 12.7 miles away | Not Yet Rated | - |
| River Montessori Elementary Charter School 1-4 | 76 Students | 16.1 miles away | Not Yet Rated | - |
| Novato Charter School KG-8 | 246 Students | 20.6 miles away | Not Yet Rated | |
Compare This School To Nearby Schools ->
School Community Forum

Join a discussion about Napa Valley Language Academy and talk to others in the community including students, parents, teachers, and administrators.
Popular Discussion Topics
- Admissions and Registration Questions (e.g. Dress Code and Discipline Policy)
- School Calendar and Upcoming Events (e.g. Graduation)
- After School Programs, Extracurricular Activities, and Athletics (e.g. Football)
- News and Announcements (e.g. Yearbook and Class Supply List Details)
- Graduate and Alumni Events (e.g. Organizing Class Reunions)
Navigation
Can't Find What You Are Looking For?
Rankings
Nearby Cities
Sponsored Links
K-12 Articles

Idle Hands
The worst affliction affecting our kids today is not teen pregnancy, drugs and alcohol, or...
The worst affliction affecting our kids today is not teen pregnancy, drugs and alcohol, or...

Everyone Loves Going to the Doctor and Dentist
Going to the doctor or dentist can be traumatic for children of all ages. Many adults do not...
Going to the doctor or dentist can be traumatic for children of all ages. Many adults do not...

Those Pesky Little Transitions
Transitions are rarely easy, yet we have to encounter them every day of our lives. For school-aged...
Transitions are rarely easy, yet we have to encounter them every day of our lives. For school-aged...