American Canyon Middle School
Rating
Not Available
Not Available

No Reviews Yet
Find Old Friends From American Canyon Middle School
Use the form below to search for alumni from American Canyon Middle School.
School Description
School Summary and Highlights
- Enrolls 877 middle school students from grades 6-8
- Ranks 815th out of 2,050 middle schools in CA.
- 2010 Overall School AYP Met Status: No
School Operational Details
- Title I Eligible
School District Details
- Napa Valley Unified School District
- Per-Pupil Spending: $8,474
- Graduation Rate: 73.7%
- Dropout Rate: 4.5%
- Students Per Teacher: 21.4
- Enrolled Students: 17,691
Faculty Details and Student Enrollment
Students and Faculty
- Total Students Enrolled: 877
- Total Full Time "Equivalent" Teachers: 38.0
- Average Student-To-Teacher Ratio: 23.1
Students Gender Breakdown
- Males: 439 (50.1%)
- Females: 438 (49.9%)
Free Lunch Student Eligibility Breakdown
- Eligible for Reduced Lunch: 68 (7.8%)
- Eligible for Free Lunch: 187 (21.3%)
- Eligible for Either Reduced or Free Lunch: 255 (29.1%)
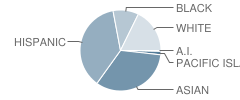
Student Enrollment Distribution by Race / Ethnicity
| Number | Percent | |
|---|---|---|
| American Indian | 4 | 0.5% |
| Black | 82 | 9.4% |
| Asian | 263 | 30.0% |
| Hispanic | 294 | 33.5% |
| White | 141 | 16.1% |
Number of Students Per Grade

| Number | Percent | |
|---|---|---|
| 6th Grade | 317 | 36.1% |
| 7th Grade | 285 | 32.5% |
| 8th Grade | 275 | 31.4% |
Teacher Education Background (2009)
Percent With Ph.D.
School:
2.4%
District:
9.6%
Percent With Master's Degree
School:
38.1%
District:
48.1%
Percent With Bachelor's Degree
School:
57.1%
District:
7.7%
Teacher Credentials & Experience (2009)
Percent of Teachers With Credentials: 100.0%
Number of Certificated Staff: 42.0
Average Number of Years of Teacher Experience: 8.8
Average Age
School:
39.6
District:
51.9
Source: CA Department of Education, Source: NCES 2009-2010
School Ratings and Reviews
Be The First To Review American Canyon Middle School!
School Map and Similar Schools Nearby
Click to Activate Map of Nearby School Campuses
Private
Public
This School
Similar Schools Nearby
| Solano Middle School 6-8 | 648 Students | 1.8 miles away |  5 out of 5 | |
| Vallejo Middle School 6-8 | 687 Students | 4.2 miles away | Not Yet Rated | |
| Springstowne Middle School 6-8 | 980 Students | 5.1 miles away | Not Yet Rated | |
| Franklin Middle School 6-8 | 769 Students | 5.3 miles away | Not Yet Rated | |
| Harvest Middle School 6-8 | 830 Students | 8.4 miles away |  4 out of 5 | |
| Carquinez Middle School 6-8 | 366 Students | 8.6 miles away | Not Yet Rated | |
| Silverado Middle School 6-8 | 784 Students | 8.6 miles away | 4 out of 5 | |
| Benicia Middle School 6-8 | 1,222 Students | 8.8 miles away |  1 out of 5 | |
| Redwood Middle School 6-8 | 1,019 Students | 10.9 miles away | 5 out of 5 | |
| Lupine Hills Elementary School KG-6 | 424 Students | 11.3 miles away | Not Yet Rated | |
Compare This School To Nearby Schools ->
School Community Forum

Join a discussion about American Canyon Middle School and talk to others in the community including students, parents, teachers, and administrators.
Popular Discussion Topics
- Admissions and Registration Questions (e.g. Dress Code and Discipline Policy)
- School Calendar and Upcoming Events (e.g. Graduation)
- After School Programs, Extracurricular Activities, and Athletics (e.g. Football)
- News and Announcements (e.g. Yearbook and Class Supply List Details)
- Graduate and Alumni Events (e.g. Organizing Class Reunions)
Navigation
Can't Find What You Are Looking For?
Rankings
Nearby Cities
Sponsored Links
K-12 Articles

Transform Your Middle School Slacker into a Scholar
All children need motivation to learn. Have your child's grades decreased since he started middle...
All children need motivation to learn. Have your child's grades decreased since he started middle...

Changing Schools Isn't Easy: Tips for a Successful Transition
It isn't easy for students to make the transition into a new school, especially if they have...
It isn't easy for students to make the transition into a new school, especially if they have...

Assisting Students to Overcome Test Anxiety
Every human copes with anxiety at one time or another. It is a basic emotion that we feel when...
Every human copes with anxiety at one time or another. It is a basic emotion that we feel when...