Central Elementary School
Rating
Not Available
Not Available

5 out of 5 | 1 Review
Find Old Friends From Central Elementary School
Use the form below to search for alumni from Central Elementary School.
School Description
School Summary and Highlights
- Enrolls 706 elementary school students from grades KG-6
- Ranks 4225th out of 5,423 elementary schools in CA.
- 2010 Overall School AYP Met Status: No
Additional Contact Information
- Mailing Address: 933 E Ave., National City, CA 91950
School Operational Details
- Title I EligibleAll students of this school are eligible for participation in authorized programs.
School District Details
- National Elementary School District
- Per-Pupil Spending: $9,302
- Students Per Teacher: 23.6
- Enrolled Students: 6,001
Faculty Details and Student Enrollment
Students and Faculty
- Total Students Enrolled: 706
- Total Full Time "Equivalent" Teachers: 27.0
- Average Student-To-Teacher Ratio: 26.2
Students Gender Breakdown
- Males: 363 (51.4%)
- Females: 343 (48.6%)
Free Lunch Student Eligibility Breakdown
- Eligible for Reduced Lunch: 144 (20.4%)
- Eligible for Free Lunch: 473 (67.0%)
- Eligible for Either Reduced or Free Lunch: 617 (87.4%)
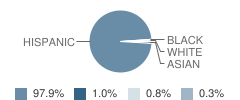
Student Enrollment Distribution by Race / Ethnicity
| Number | Percent | |
|---|---|---|
| American Indian | - | - |
| Black | 2 | 0.3% |
| Asian | 6 | 0.8% |
| Hispanic | 594 | 84.1% |
| White | 5 | 0.7% |
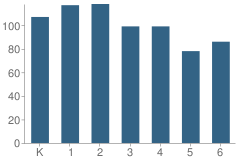
Number of Students Per Grade
| Number | Percent | |
|---|---|---|
| Kindergarten | 107 | 15.2% |
| 1st Grade | 117 | 16.6% |
| 2nd Grade | 118 | 16.7% |
| 3rd Grade | 99 | 14.0% |
| 4th Grade | 99 | 14.0% |
| 5th Grade | 78 | 11.0% |
| 6th Grade | 86 | 12.2% |
| Ungraded | 2 | 0.3% |
Teacher Education Background (2009)
Percent With Master's Degree: 30.0%
Percent With Bachelor's Degree
School:
12.5%
District:
16.7%
Teacher Credentials & Experience (2009)
Percent of Teachers With Credentials: 100.0%
Number of Certificated Staff: 40.0
Average Number of Years of Teacher Experience: 14.1
Average Age
School:
41.2
District:
52.0
Source: CA Department of Education, Source: NCES 2009-2010
School Ratings and Reviews
Overall Rating: 5

5 out of 5 | 1 Review
The Overall Rating is the school's average rating from parents, students, school faculty and staff. The highest rating is five apples and the lowest is one apple.
Share Your Review About This School
1 review for Central Elementary School
- Reviewed by Parent/Guardian on October 04, 2010
- Rating:
 (5 / 5) Flag as inappropriate
 - This school has the most dedicated teaching staff in the district. Parent participation is very limited, however, the teachers deal with apathy by trying to energize the students deep desire to learn. Great work teachers.
School Map and Similar Schools Nearby
Click to Activate Map of Nearby School Campuses
Private
Public
This School
Similar Schools Nearby
| John A. Otis Elementary School KG-6 | 412 Students | 0.5 miles away | Not Yet Rated | |
| Kimball School KG-6 | 420 Students | 0.7 miles away | Not Yet Rated | |
| Olivewood School KG-6 | 702 Students | 1.0 miles away | Not Yet Rated | |
| Las Palmas School KG-6 | 749 Students | 1.0 miles away |  5 out of 5 | |
| Rancho De La Nacion School KG-6 | 510 Students | 1.0 miles away |  1 out of 5 | |
| El Toyon Elementary School KG-6 | 418 Students | 1.1 miles away | Not Yet Rated | |
| Lincoln Acres School KG-6 | 638 Students | 1.5 miles away | Not Yet Rated | |
| Palmer Way School KG-6 | 615 Students | 1.6 miles away | 5 out of 5 | |
| Ira Harbison School KG-6 | 609 Students | 1.7 miles away | 5 out of 5 | |
| Rosebank Elementary School KG-6 | 668 Students | 2.4 miles away |  2.5 out of 5 | |
Compare This School To Nearby Schools ->
School Community Forum

Join a discussion about Central Elementary School and talk to others in the community including students, parents, teachers, and administrators.
Popular Discussion Topics
- Admissions and Registration Questions (e.g. Dress Code and Discipline Policy)
- School Calendar and Upcoming Events (e.g. Graduation)
- After School Programs, Extracurricular Activities, and Athletics (e.g. Football)
- News and Announcements (e.g. Yearbook and Class Supply List Details)
- Graduate and Alumni Events (e.g. Organizing Class Reunions)
Navigation
Can't Find What You Are Looking For?
Rankings
Nearby Cities
Sponsored Links
K-12 Articles

The Very Best Things in the World
A recent poll in the U.K. revealed that children view the "very best thing in the world" as being...
A recent poll in the U.K. revealed that children view the "very best thing in the world" as being...

Help Your Child Achieve Success in Middle School
Middle school is for children between the ages of 10 and 14 years. At this time children begin to...
Middle school is for children between the ages of 10 and 14 years. At this time children begin to...

Adolescents, Sleep and Learning
Recently, adolescent's sleep habits have been in the news. Research has shown that adolescents need...
Recently, adolescent's sleep habits have been in the news. Research has shown that adolescents need...