Lincoln Elementary School
Rating
Not Available
Not Available

5 out of 5 | 1 Review
Find Old Friends From Lincoln Elementary School
Use the form below to search for alumni from Lincoln Elementary School.
School Description
School Summary and Highlights
- Enrolls 401 elementary school students from grades KG-6
- Ranks 2874th out of 5,423 elementary schools in CA.
- 2010 Overall School AYP Met Status: No
Additional Contact Information
- Mailing Address: 36111 Bettencourt St., Newark, CA 94560
School District Details
- Newark Unified School District
- Per-Pupil Spending: $8,985
- Graduation Rate: 77.3%
- Dropout Rate: 3.0%
- Students Per Teacher: 23.9
- Enrolled Students: 6,916
Faculty Details and Student Enrollment
Students and Faculty
- Total Students Enrolled: 401
- Total Full Time "Equivalent" Teachers: 18.0
- Average Student-To-Teacher Ratio: 22.3
Students Gender Breakdown
- Males: 205 (51.1%)
- Females: 196 (48.9%)
Free Lunch Student Eligibility Breakdown
- Eligible for Reduced Lunch: 37 (9.2%)
- Eligible for Free Lunch: 144 (35.9%)
- Eligible for Either Reduced or Free Lunch: 181 (45.1%)
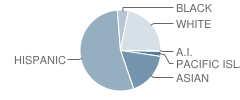
Student Enrollment Distribution by Race / Ethnicity
| Number | Percent | |
|---|---|---|
| American Indian | 2 | 0.5% |
| Black | 17 | 4.2% |
| Asian | 66 | 16.5% |
| Hispanic | 204 | 50.9% |
| White | 83 | 20.7% |
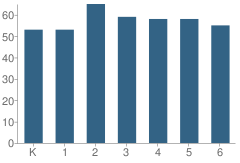
Number of Students Per Grade
| Number | Percent | |
|---|---|---|
| Kindergarten | 53 | 13.2% |
| 1st Grade | 53 | 13.2% |
| 2nd Grade | 65 | 16.2% |
| 3rd Grade | 59 | 14.7% |
| 4th Grade | 58 | 14.5% |
| 5th Grade | 58 | 14.5% |
| 6th Grade | 55 | 13.7% |
Teacher Education Background (2009)
Percent With Master's Degree
School:
9.1%
District:
10.7%
Percent With Bachelor's Degree
School:
9.1%
District:
7.1%
Teacher Credentials & Experience (2009)
Percent of Teachers With Credentials: 90.5%
Number of Certificated Staff: 22.0
Average Number of Years of Teacher Experience: 9.9
Average Age
School:
39.9
District:
49.3
Source: CA Department of Education, Source: NCES 2009-2010
School Ratings and Reviews
Overall Rating: 5

5 out of 5 | 1 Review
The Overall Rating is the school's average rating from parents, students, school faculty and staff. The highest rating is five apples and the lowest is one apple.
Share Your Review About This School
1 review for Lincoln Elementary School
- Reviewed by Parent/Guardian on October 28, 2010
- Rating:
 (5 / 5) Flag as inappropriate
 - this is the best school iv ever been to
School Map and Similar Schools Nearby
Click to Activate Map of Nearby School Campuses
Private
Public
This School
Similar Schools Nearby
| H. A. Snow Elementary School KG-6 | 435 Students | 0.5 miles away | Not Yet Rated | |
| James A. Graham Elementary School KG-6 | 497 Students | 0.6 miles away | Not Yet Rated | |
| August Schilling Elementary School KG-6 | 541 Students | 0.6 miles away |  4.5 out of 5 | |
| E. L. Musick Elementary School KG-6 | 377 Students | 1.2 miles away | Not Yet Rated | |
| John F. Kennedy Elementary School KG-6 | 428 Students | 1.2 miles away | Not Yet Rated | |
| Louis Milani Elementary School KG-6 | 404 Students | 1.6 miles away |  5 out of 5 | |
| Forest Park Elementary School KG-6 | 893 Students | 1.7 miles away | 5 out of 5 | |
| Cabrillo Elementary School KG-6 | 404 Students | 1.9 miles away | Not Yet Rated | |
| James L. Bunker Elementary School KG-6 | 572 Students | 2.1 miles away | Not Yet Rated | |
| Patterson Elementary School KG-6 | 576 Students | 2.2 miles away | Not Yet Rated | |
Compare This School To Nearby Schools ->
School Community Forum

Join a discussion about Lincoln Elementary School and talk to others in the community including students, parents, teachers, and administrators.
Popular Discussion Topics
- Admissions and Registration Questions (e.g. Dress Code and Discipline Policy)
- School Calendar and Upcoming Events (e.g. Graduation)
- After School Programs, Extracurricular Activities, and Athletics (e.g. Football)
- News and Announcements (e.g. Yearbook and Class Supply List Details)
- Graduate and Alumni Events (e.g. Organizing Class Reunions)
Navigation
Can't Find What You Are Looking For?
Rankings
Nearby Cities
Sponsored Links
K-12 Articles

Bullycide: What is It and How Can It Be Prevented?
Disclaimer: This article expresses my opinion that has been formed by personal experience and...
Disclaimer: This article expresses my opinion that has been formed by personal experience and...

Parent-Teacher Conference Dos and Don'ts
Finals are over and done, and grades have arrived. Now comes the dreaded time to discuss the...
Finals are over and done, and grades have arrived. Now comes the dreaded time to discuss the...

Does Your Child's Teacher Make a Difference
School improvement is always in the news. Teachers demand smaller class sizes. The government calls...
School improvement is always in the news. Teachers demand smaller class sizes. The government calls...