Norwalk High School
11356 East Leffingwell Rd, Norwalk, CA 90650 | (562) 868-0431
- Grades: 9-12
- Student Enrollment: 2,321
Rating
Not Available
Not Available

3 out of 5 | 2 Reviews
Find Old Friends From Norwalk High School
Use the form below to search for alumni from Norwalk High School.
School Description
School Summary and Highlights
- Enrolls 2,321 high school students from grades 9-12
- Ranks 1039th out of 1,197 high schools in CA.
- 2010 Overall School AYP Met Status: No
Additional Contact Information
- Mailing Address: 11356 East Leffingwell Rd., Norwalk, CA 90650
School District Details
- Norwalk-La Mirada Unified School District
- Per-Pupil Spending: $8,892
- Graduation Rate: 68.7%
- Dropout Rate: 1.5%
- Students Per Teacher: 22.3
- Enrolled Students: 20,659
Faculty Details and Student Enrollment
Students and Faculty
- Total Students Enrolled: 2,321
- Total Full Time "Equivalent" Teachers: 90.2
- Average Student-To-Teacher Ratio: 25.7
Students Gender Breakdown
- Males: 1,175 (50.6%)
- Females: 1,146 (49.4%)
Free Lunch Student Eligibility Breakdown
- Eligible for Reduced Lunch: 249 (10.7%)
- Eligible for Free Lunch: 1,210 (52.1%)
- Eligible for Either Reduced or Free Lunch: 1,459 (62.9%)
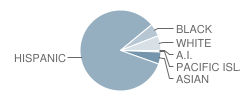
Student Enrollment Distribution by Race / Ethnicity
| Number | Percent | |
|---|---|---|
| American Indian | 8 | 0.3% |
| Black | 119 | 5.1% |
| Asian | 113 | 4.9% |
| Hispanic | 1,921 | 82.8% |
| White | 138 | 5.9% |
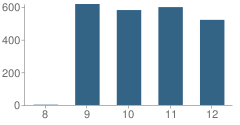
Number of Students Per Grade
| Number | Percent | |
|---|---|---|
| 8th Grade | 2 | 0.09% |
| 9th Grade | 618 | 26.6% |
| 10th Grade | 581 | 25.0% |
| 11th Grade | 599 | 25.8% |
| 12th Grade | 521 | 22.4% |
Graduates Information (2010)
Graduation Rate
School:
81.0%
District:
76.5%
State:
78.6%
Teacher Education Background (2009)
Percent With Ph.D.
School:
2.8%
District:
5.0%
Percent With Master's Degree
School:
5.7%
District:
10.0%
Percent With Bachelor's Degree
School:
12.3%
District:
17.5%
Teacher Credentials & Experience (2009)
Percent of Teachers With Emergency Credentials: 9.7%
Percent of Teachers With Credentials: 82.8%
Number of Certificated Staff: 106.0
Average Number of Years of Teacher Experience: 10.1
Average Age
School:
40.5
District:
47.1
Source: CA Department of Education, Source: NCES 2009-2010
School Ratings and Reviews
Overall Rating: 3

3 out of 5 | 2 Reviews
The Overall Rating is the school's average rating from parents, students, school faculty and staff. The highest rating is five apples and the lowest is one apple.
Share Your Review About This School
2 reviews for Norwalk High School
- Reviewed by Student on October 18, 2009
- Rating:
 (1 / 5) Flag as inappropriate
 - This school sucks, dont go here. It will not prepare you for college. I ended up doing fairly well in high school (4.0). I went onto a UC institution and got rocked by the competition. It took me a while to get adjusted to college.
- Reviewed by Parent/Guardian on April 20, 2009
- Rating:
 (5 / 5) Flag as inappropriate
 - I love this school!
School Map and Similar Schools Nearby
Click to Activate Map of Nearby School Campuses
Private
Public
This School
Similar Schools Nearby
| Bellflower High School 7-12 | 3,116 Students | 1.7 miles away |  5 out of 5 | |
| John H. Glenn High School 9-12 | 1,871 Students | 2.0 miles away | Not Yet Rated | |
| Santa Fe High School 9-12 | 2,932 Students | 2.3 miles away | 5 out of 5 | |
| Richard Gahr High School 9-12 | 2,058 Students | 2.4 miles away | 5 out of 5 | |
| Gretchen Whitney High School 7-12 | 1,022 Students | 2.8 miles away | Not Yet Rated | |
| Downey High School 9-12 | 4,016 Students | 3.0 miles away | Not Yet Rated | |
| Cerritos High School 9-12 | 2,134 Students | 3.2 miles away | Not Yet Rated | |
| Mayfair High School 7-12 | 3,579 Students | 3.3 miles away | Not Yet Rated | |
| Warren High School 9-12 | 3,666 Students | 3.4 miles away |  4 out of 5 | |
| Paramount High School 9-12 | 4,758 Students | 3.5 miles away | Not Yet Rated | |
Compare This School To Nearby Schools ->
School Community Forum

Join a discussion about Norwalk High School and talk to others in the community including students, parents, teachers, and administrators.
Popular Discussion Topics
- Admissions and Registration Questions (e.g. Dress Code and Discipline Policy)
- School Calendar and Upcoming Events (e.g. Graduation)
- After School Programs, Extracurricular Activities, and Athletics (e.g. Football)
- News and Announcements (e.g. Yearbook and Class Supply List Details)
- Graduate and Alumni Events (e.g. Organizing Class Reunions)
Navigation
Can't Find What You Are Looking For?
Rankings
Nearby Cities
Sponsored Links
K-12 Articles

Keep Morning Stress at a Minimum: Establish a Routine
Morning! It can be a time of stress. The kids are fighting over who gets to use the bathroom first,...
Morning! It can be a time of stress. The kids are fighting over who gets to use the bathroom first,...

Help Your Child Achieve Success in Middle School
Middle school is for children between the ages of 10 and 14 years. At this time children begin to...
Middle school is for children between the ages of 10 and 14 years. At this time children begin to...

Se Hablan Otras Idiomas?
In the late 1990s, the Salem-Keizer school district in Oregon began requiring every student in its...
In the late 1990s, the Salem-Keizer school district in Oregon began requiring every student in its...