Nuview Bridge Academy
Rating
Not Available
Not Available

No Reviews Yet
Find Old Friends From Nuview Bridge Academy
Use the form below to search for alumni from Nuview Bridge Academy.
School Description
School Summary and Highlights
- Enrolls 351 high school students from grades 9-12
- Ranks 316th out of 1,197 high schools in CA.
- 2010 Overall School AYP Met Status: Yes
Additional Contact Information
- Mailing Address: 30401 Reservoir Ave., Nuevo, CA 92567
School Operational Details
- Charter School
School District Details
- Nuview Union Elementary School District
- Per-Pupil Spending: $8,882
- Graduation Rate: 54.9%
- Students Per Teacher: 21.9
- Enrolled Students: 2,051
Faculty Details and Student Enrollment
Students and Faculty
- Total Students Enrolled: 351
- Total Full Time "Equivalent" Teachers: 16.0
- Average Student-To-Teacher Ratio: 21.9
Students Gender Breakdown
- Males: 133 (37.9%)
- Females: 218 (62.1%)
Free Lunch Student Eligibility Breakdown
- Eligible for Reduced Lunch: 52 (14.8%)
- Eligible for Free Lunch: 149 (42.5%)
- Eligible for Either Reduced or Free Lunch: 201 (57.3%)
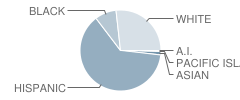
Student Enrollment Distribution by Race / Ethnicity
| Number | Percent | |
|---|---|---|
| American Indian | 1 | 0.3% |
| Black | 30 | 8.5% |
| Asian | 5 | 1.4% |
| Hispanic | 218 | 62.1% |
| White | 93 | 26.5% |
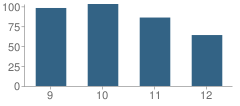
Number of Students Per Grade
| Number | Percent | |
|---|---|---|
| 9th Grade | 98 | 27.9% |
| 10th Grade | 103 | 29.3% |
| 11th Grade | 86 | 24.5% |
| 12th Grade | 64 | 18.2% |
Graduates Information (2010)
Graduation Rate
School:
98.4%
District:
98.4%
State:
78.6%
Teacher Education Background (2009)
Percent With Bachelor's Degree: 22.2%
Percent With Master's Degree
School:
55.6%
District:
66.7%
Teacher Credentials & Experience (2009)
Average Age
School:
36.8
District:
53.0
Average Number of Years of Teacher Experience: 6.8
Number of Certificated Staff: 18.0
Percent of Teachers With Credentials: 100.0%
Percent of Teachers With Emergency Credentials: 13.3%
Source: CA Department of Education, Source: NCES 2009-2010
School Ratings and Reviews
Be The First To Review Nuview Bridge Academy!
School Map and Similar Schools Nearby
Click to Activate Map of Nearby School Campuses
Private
Public
This School
Similar Schools Nearby
| Choice 2000 On-Line School 7-12 | 234 Students | 6.4 miles away | Not Yet Rated | |
| California Military Institute School 7-12 | 542 Students | 6.5 miles away | Not Yet Rated | |
| Moreno Valley Community Learning Center School 7-12 | 101 Students | 8.3 miles away | Not Yet Rated | |
| San Jacinto Valley Academy KG-12 | 596 Students | 10.0 miles away |  5 out of 5 | |
| Santa Rosa Academy KG-12 | 573 Students | 10.8 miles away | Not Yet Rated | |
| Hemet Academy for Applied Academics and Technology 9-12 | 213 Students | 11.0 miles away | 5 out of 5 | - |
| Temecula Preparatory School KG-12 | 696 Students | 15.2 miles away |  1 out of 5 | |
| Grove School 7-12 | 186 Students | 16.3 miles away | Not Yet Rated | |
| Gateway to College Early College High School 9-12 | 198 Students | 17.7 miles away | Not Yet Rated | |
Compare This School To Nearby Schools ->
School Community Forum

Join a discussion about Nuview Bridge Academy and talk to others in the community including students, parents, teachers, and administrators.
Popular Discussion Topics
- Admissions and Registration Questions (e.g. Dress Code and Discipline Policy)
- School Calendar and Upcoming Events (e.g. Graduation)
- After School Programs, Extracurricular Activities, and Athletics (e.g. Football)
- News and Announcements (e.g. Yearbook and Class Supply List Details)
- Graduate and Alumni Events (e.g. Organizing Class Reunions)
Navigation
Can't Find What You Are Looking For?
Rankings
Nearby Cities
Sponsored Links
K-12 Articles

The Importance of Reading for Children Preschool to Grade Three
The first teachers of children are their parents. From the time they are infants, children need to...
The first teachers of children are their parents. From the time they are infants, children need to...

Attend Your Teen's Holiday Parties
Christmas and New Years are coming, and with them Christmas and New Years Eve parties. At many of...
Christmas and New Years are coming, and with them Christmas and New Years Eve parties. At many of...

Feeling Good in Your Own Skin
Body image is a very touchy issue with today’s kids. Since the 1950s, when Barbie was first...
Body image is a very touchy issue with today’s kids. Since the 1950s, when Barbie was first...