Del Roble Elementary School
Rating
Not Available
Not Available

No Reviews Yet
Find Old Friends From Del Roble Elementary School
Use the form below to search for alumni from Del Roble Elementary School.
School Description
School Summary and Highlights
- Enrolls 504 elementary school students from grades KG-6
- Ranks 3904th out of 5,423 elementary schools in CA.
- 2010 Overall School AYP Met Status: No
School District Details
- Oak Grove Elementary School District
- Per-Pupil Spending: $8,487
- Students Per Teacher: 20.8
- Enrolled Students: 11,569
Faculty Details and Student Enrollment
Students and Faculty
- Total Students Enrolled: 504
- Total Full Time "Equivalent" Teachers: 24.0
- Average Student-To-Teacher Ratio: 21.0
Students Gender Breakdown
- Males: 257 (51.0%)
- Females: 247 (49.0%)
Free Lunch Student Eligibility Breakdown
- Eligible for Reduced Lunch: 64 (12.7%)
- Eligible for Free Lunch: 264 (52.4%)
- Eligible for Either Reduced or Free Lunch: 328 (65.1%)
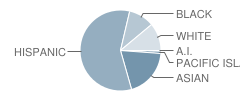
Student Enrollment Distribution by Race / Ethnicity
| Number | Percent | |
|---|---|---|
| American Indian | 2 | 0.4% |
| Black | 51 | 10.1% |
| Asian | 96 | 19.0% |
| Hispanic | 286 | 56.7% |
| White | 55 | 10.9% |
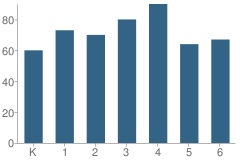
Number of Students Per Grade
| Number | Percent | |
|---|---|---|
| Kindergarten | 60 | 11.9% |
| 1st Grade | 73 | 14.5% |
| 2nd Grade | 70 | 13.9% |
| 3rd Grade | 80 | 15.9% |
| 4th Grade | 90 | 17.9% |
| 5th Grade | 64 | 12.7% |
| 6th Grade | 67 | 13.3% |
Teacher Education Background (2009)
Percent With Master's Degree
School:
3.8%
District:
11.9%
Percent With Bachelor's Degree
School:
11.5%
District:
6.8%
Teacher Credentials & Experience (2009)
Percent of Teachers With Credentials: 92.0%
Number of Certificated Staff: 26.0
Average Number of Years of Teacher Experience: 11.7
Average Age
School:
42.6
District:
46.4
Source: CA Department of Education, Source: NCES 2009-2010
School Ratings and Reviews
Be The First To Review Del Roble Elementary School!
School Map and Similar Schools Nearby
Click to Activate Map of Nearby School Campuses
Private
Public
This School
Similar Schools Nearby
| Hayes Elementary School KG-6 | 579 Students | 0.6 miles away | Not Yet Rated | |
| Frost (Earl) Elementary School KG-6 | 635 Students | 0.7 miles away | Not Yet Rated | |
| Miner (George) Elementary School KG-6 | 525 Students | 1.1 miles away | Not Yet Rated | |
| Parkview Elementary School KG-6 | 698 Students | 1.1 miles away | Not Yet Rated | |
| Allen at Steinbeck School KG-8 | 836 Students | 1.3 miles away | Not Yet Rated | |
| Rachel Carson Elementary School KG-5 | 445 Students | 1.3 miles away | Not Yet Rated | |
| Oak Ridge Elementary School KG-6 | 596 Students | 1.4 miles away | Not Yet Rated | |
| Anderson (Alex) Elementary School KG-6 | 617 Students | 1.5 miles away |  5 out of 5 | |
| Seven Trees Elementary School KG-6 | 576 Students | 1.8 miles away | 5 out of 5 | |
| Christopher Elementary School KG-6 | 462 Students | 1.8 miles away | Not Yet Rated | |
Compare This School To Nearby Schools ->
School Community Forum

Join a discussion about Del Roble Elementary School and talk to others in the community including students, parents, teachers, and administrators.
Popular Discussion Topics
- Admissions and Registration Questions (e.g. Dress Code and Discipline Policy)
- School Calendar and Upcoming Events (e.g. Graduation)
- After School Programs, Extracurricular Activities, and Athletics (e.g. Football)
- News and Announcements (e.g. Yearbook and Class Supply List Details)
- Graduate and Alumni Events (e.g. Organizing Class Reunions)
Navigation
Can't Find What You Are Looking For?
Rankings
Nearby Cities
Sponsored Links
K-12 Articles

What to Do when Your Child Hates School
All kids grumble about going to school at one time or another. This is perfectly normal, but what...
All kids grumble about going to school at one time or another. This is perfectly normal, but what...

Tips for Purchasing Back to School Supplies
In just a few days, kids from all over the US will be going back to school. Now is the time to take...
In just a few days, kids from all over the US will be going back to school. Now is the time to take...

Changing Schools Isn't Easy: Tips for a Successful Transition
It isn't easy for students to make the transition into a new school, especially if they have...
It isn't easy for students to make the transition into a new school, especially if they have...