Villa Park High School
Rating
Not Available
Not Available

3.5 out of 5 | 7 Reviews
Find Old Friends From Villa Park High School
Use the form below to search for alumni from Villa Park High School.
School Description
School Summary and Highlights
- Enrolls 2,488 high school students from grades 9-12
- Ranks 230th out of 1,197 high schools in CA.
- 2010 Overall School AYP Met Status: No
Additional Contact Information
- Mailing Address: 18042 Taft Ave., Villa Park, CA 92861
School District Details
- Orange Unified School District
- Per-Pupil Spending: $8,451
- Graduation Rate: 80.0%
- Dropout Rate: 2.0%
- Students Per Teacher: 25.5
- Enrolled Students: 30,167
Faculty Details and Student Enrollment
Students and Faculty
- Total Students Enrolled: 2,488
- Total Full Time "Equivalent" Teachers: 84.6
- Average Student-To-Teacher Ratio: 29.4
Students Gender Breakdown
- Males: 1,298 (52.2%)
- Females: 1,190 (47.8%)
Free Lunch Student Eligibility Breakdown
- Eligible for Reduced Lunch: 112 (4.5%)
- Eligible for Free Lunch: 382 (15.4%)
- Eligible for Either Reduced or Free Lunch: 494 (19.9%)
Student Enrollment Distribution by Race / Ethnicity

| Number | Percent | |
|---|---|---|
| American Indian | 15 | 0.6% |
| Black | 28 | 1.1% |
| Asian | 293 | 11.8% |
| Hispanic | 771 | 31.0% |
| White | 1,315 | 52.9% |
Number of Students Per Grade
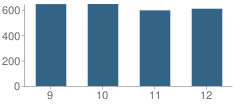
| Number | Percent | |
|---|---|---|
| 9th Grade | 643 | 25.8% |
| 10th Grade | 644 | 25.9% |
| 11th Grade | 594 | 23.9% |
| 12th Grade | 607 | 24.4% |
Graduates Information (2010)
Graduation Rate
School:
96.9%
District:
91.2%
State:
78.6%
Teacher Education Background (2009)
Percent With Ph.D.
School:
3.1%
District:
5.9%
Percent With Master's Degree
School:
41.2%
District:
46.5%
Percent With Bachelor's Degree
School:
8.2%
District:
5.9%
Teacher Credentials & Experience (2009)
Percent of Teachers With Emergency Credentials: 1.1%
Percent of Teachers With Credentials: 96.6%
Number of Certificated Staff: 97.0
Average Number of Years of Teacher Experience: 9.5
Average Age
School:
43.1
District:
46.5
Source: CA Department of Education, Source: NCES 2009-2010
School Ratings and Reviews
Overall Rating: 3.5

3.5 out of 5 | 7 Reviews
The Overall Rating is the school's average rating from parents, students, school faculty and staff. The highest rating is five apples and the lowest is one apple.
Share Your Review About This School
7 reviews for Villa Park High School
- Reviewed by Parent or Guardian on February 15, 2011
- Rating:
 (5 / 5) Flag as inappropriate
 - I have a daughter who attended villa park high school from 2006 thru 2009 she participated in alot of things offered at villa park,she ran cross country all four years she loved her teammates and learned alot from the program.She took lots of honors and ap classes and scored above average on all of her ap exams she has personally told be she gives alot of credit to her teachers exspecially Mrs. Mooney and Mr.Hunt she was actively involed in clubs student senate and attended all of the dances.She is attending a top university and is graduatin in three years next spring and she gives alot of credit ti villa park high school for preparing her she has nothing but fond memories of her four years there. I curently have three more children there in 10,11,12 grades im proud to say my children attend this school,all of my children attended private lower education schools before ariving at villa park and i can say villa park has everything to offer students if they just take advantage of there time there work hard play hard and go forward into there futures.
- Reviewed by Student on September 30, 2010
- Rating: (5 / 5) Flag as inappropriate
- so far i love villa park high school
- Reviewed by Parent/Guardian on September 21, 2010
- Rating:
 (2 / 5) Flag as inappropriate
 - its a g school all the homies r there
- Reviewed by Student on April 20, 2009
- Rating:
 (3 / 5) Flag as inappropriate
 - SOME OF THE TEACHERS DONT CARE ABOUT THE WORK AND THE AMOUNT OF WORK WE GET. IT IS REDONCULOUS HOW MOST OF THE TEACHERS THERE DO NOT CARE IF YOU HAVE OTHER HOMEWORK . TO THEM THEIR ASSINMENTS ARE THE ONLY ONES THAT COUNT. THERE ARE GOOD TEACHERS THERE HOWEVER THERE ARE NOT THAT MANY ...... OH AND PEOPLE ALWAYS DRINK AND SMOKE THERE IT IS NASTY
- Reviewed by Student on October 03, 2008
- Rating:
 (1 / 5) Flag as inappropriate
 - This school sucks, everyone does drugs,******and other activities there.
- Reviewed by Former Student on July 14, 2008
- Rating: (5 / 5) Flag as inappropriate
- great memories
- Reviewed by Student on October 17, 2007
- Rating: (5 / 5) Flag as inappropriate
- I love Villa park
I must say this high school has changed my life
and i know every teacher there makes it their personal duty to educate us.
Read All 7 Reviews ->
School Map and Similar Schools Nearby
Click to Activate Map of Nearby School Campuses
Private
Public
This School
Similar Schools Nearby
| El Modena High School 9-12 | 2,181 Students | 1.8 miles away | Not Yet Rated | |
| Orange High School 9-12 | 2,375 Students | 2.2 miles away | Not Yet Rated | |
| Canyon High School 9-12 | 2,405 Students | 2.7 miles away | Not Yet Rated | |
| Foothill High School 9-12 | 2,221 Students | 3.5 miles away | Not Yet Rated | |
| Esperanza High School 9-12 | 2,480 Students | 3.7 miles away | Not Yet Rated | |
| South Junior High School 7-8 | 1,504 Students | 3.9 miles away |  3 out of 5 | |
| Katella High School 9-12 | 2,672 Students | 3.9 miles away | 3 out of 5 | |
| Sycamore Junior High School 7-8 | 1,606 Students | 4.8 miles away |  5 out of 5 | |
| Tustin High School 9-12 | 2,132 Students | 5.5 miles away | Not Yet Rated | |
| Ladera Vista Junior High School 7-8 | 950 Students | 5.9 miles away | Not Yet Rated | |
Compare This School To Nearby Schools ->
School Community Forum

Join a discussion about Villa Park High School and talk to others in the community including students, parents, teachers, and administrators.
Popular Discussion Topics
- Admissions and Registration Questions (e.g. Dress Code and Discipline Policy)
- School Calendar and Upcoming Events (e.g. Graduation)
- After School Programs, Extracurricular Activities, and Athletics (e.g. Football)
- News and Announcements (e.g. Yearbook and Class Supply List Details)
- Graduate and Alumni Events (e.g. Organizing Class Reunions)
Navigation
Can't Find What You Are Looking For?
Rankings
Nearby Cities
Sponsored Links
K-12 Articles

Preparing Your Child for the First Day of School
It seems like school was just dismissed for the summer, yet here we are facing another year of back...
It seems like school was just dismissed for the summer, yet here we are facing another year of back...

The Difference Between Boys and Girls
Boys and girls are different. Give a toddler girl a G.I. Joe and she'll probably try to mother it....
Boys and girls are different. Give a toddler girl a G.I. Joe and she'll probably try to mother it....

Making Sense of No Child Left Behind
The No Child Left Behind Act of 2001 has met with mixed results and mixed feelings. Some think it...
The No Child Left Behind Act of 2001 has met with mixed results and mixed feelings. Some think it...