Sierra Linda Elementary School
Rating
Not Available
Not Available

1.5 out of 5 | 3 Reviews
Find Old Friends From Sierra Linda Elementary School
Use the form below to search for alumni from Sierra Linda Elementary School.
School Description
School Summary and Highlights
- Enrolls 667 elementary school students from grades KG-6
- Ranks 3830th out of 5,423 elementary schools in CA.
- 2010 Overall School AYP Met Status: Yes
Additional Contact Information
- Mailing Address: 1051 South A St., Oxnard, CA 93030
School Operational Details
- Title I EligibleAll students of this school are eligible for participation in authorized programs.
School District Details
- Oxnard Elementary School District
- Per-Pupil Spending: $9,099
- Students Per Teacher: 23.6
- Enrolled Students: 15,554
Faculty Details and Student Enrollment
Students and Faculty
- Total Students Enrolled: 667
- Total Full Time "Equivalent" Teachers: 35.0
- Average Student-To-Teacher Ratio: 19.1
Students Gender Breakdown
- Males: 327 (49.0%)
- Females: 340 (51.0%)
Free Lunch Student Eligibility Breakdown
- Eligible for Reduced Lunch: 107 (16.0%)
- Eligible for Free Lunch: 420 (63.0%)
- Eligible for Either Reduced or Free Lunch: 527 (79.0%)
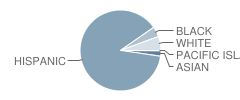
Student Enrollment Distribution by Race / Ethnicity
| Number | Percent | |
|---|---|---|
| American Indian | - | - |
| Black | 27 | 4.0% |
| Asian | 14 | 2.1% |
| Hispanic | 582 | 87.3% |
| White | 37 | 5.5% |
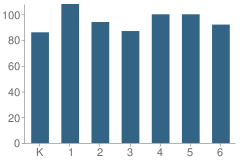
Number of Students Per Grade
| Number | Percent | |
|---|---|---|
| Kindergarten | 86 | 12.9% |
| 1st Grade | 108 | 16.2% |
| 2nd Grade | 94 | 14.1% |
| 3rd Grade | 87 | 13.0% |
| 4th Grade | 100 | 15.0% |
| 5th Grade | 100 | 15.0% |
| 6th Grade | 92 | 13.8% |
Teacher Education Background (2009)
Percent With Bachelor's Degree
School:
2.8%
District:
3.0%
Teacher Credentials & Experience (2009)
Percent of Teachers With Credentials: 100.0%
Number of Certificated Staff: 36.0
Average Number of Years of Teacher Experience: 15.8
Average Age
School:
42.8
District:
45.9
Source: CA Department of Education, Source: NCES 2009-2010
School Ratings and Reviews
Overall Rating: 1.5

1.5 out of 5 | 3 Reviews
The Overall Rating is the school's average rating from parents, students, school faculty and staff. The highest rating is five apples and the lowest is one apple.
Share Your Review About This School
3 reviews for Sierra Linda Elementary School
- Reviewed by Student on January 16, 2011
- Rating:
 (3 / 5) Flag as inappropriate
 - this is a really good school,alot of other kids call this school bad,or dangerous,but its actually pretty cool
- Reviewed by Parent/Guardian on March 15, 2010
- Rating:
 (1 / 5) Flag as inappropriate
 - Principals & teachers are quick to reprimand students instead of teaching the students what was wrong about what was done/said. How can kids learn if they don't even know why they are in trouble? School is a LEARNING experience, not a place to go to walk on egg shells. I am now looking for an alternative schooling for my child.
- Reviewed by Parent/Guardian on January 15, 2009
- Rating: (1 / 5) Flag as inappropriate
- N/A
School Map and Similar Schools Nearby
Click to Activate Map of Nearby School Campuses
Private
Public
This School
Similar Schools Nearby
| Rio Del Norte School KG-5 | 549 Students | 0.7 miles away |  3 out of 5 | |
| Curren Elementary School KG-6 | 805 Students | 0.9 miles away | Not Yet Rated | |
| Emilie Ritchen Elementary School KG-6 | 783 Students | 1.0 miles away |  5 out of 5 | |
| Norman R. Brekke Elementary School KG-6 | 760 Students | 1.5 miles away | Not Yet Rated | |
| Ramona Elementary School KG-6 | 552 Students | 1.7 miles away | Not Yet Rated | |
| Cesar E. Chavez Elementary School KG-6 | 673 Students | 1.8 miles away | Not Yet Rated | |
| Rio Rosales School KG-5 | 555 Students | 2.2 miles away | 5 out of 5 | |
| Driffill Elementary School KG-6 | 839 Students | 2.3 miles away | Not Yet Rated | |
| Rose Avenue Elementary School KG-6 | 791 Students | 2.3 miles away | 5 out of 5 | |
| Juan Lagunas Soria Elementary School KG-6 | 635 Students | 2.4 miles away | Not Yet Rated | - |
Compare This School To Nearby Schools ->
School Community Forum

Join a discussion about Sierra Linda Elementary School and talk to others in the community including students, parents, teachers, and administrators.
Popular Discussion Topics
- Admissions and Registration Questions (e.g. Dress Code and Discipline Policy)
- School Calendar and Upcoming Events (e.g. Graduation)
- After School Programs, Extracurricular Activities, and Athletics (e.g. Football)
- News and Announcements (e.g. Yearbook and Class Supply List Details)
- Graduate and Alumni Events (e.g. Organizing Class Reunions)
Navigation
Can't Find What You Are Looking For?
Rankings
Nearby Cities
Sponsored Links
K-12 Articles

Teach Your Child to Write Well
When American children head off to junior kindergarten, they must be ready to learn. It is your...
When American children head off to junior kindergarten, they must be ready to learn. It is your...

When Bad Report Cards Happen to Good Kids
It's mid-term season once again, and semester (or quarter or trimester) grades will be coming out...
It's mid-term season once again, and semester (or quarter or trimester) grades will be coming out...

Choosing a Summer Camp for Your Child
Are you planning to send your child to summer camp this year? If so, have you taken his needs into...
Are you planning to send your child to summer camp this year? If so, have you taken his needs into...