Rio Mesa High School

No Reviews Yet
Find Old Friends From Rio Mesa High School
Use the form below to search for alumni from Rio Mesa High School.
School Description
School Summary and Highlights
- Enrolls 2,205 high school students from grades 9-12
- Ranks 454th out of 1,197 high schools in CA.
- 2010 Overall School AYP Met Status: No
Additional Contact Information
- Mailing Address: 545 Central Ave., Oxnard, CA 93030
School Operational Details
- Title I EligibleAll students of this school are eligible for participation in authorized programs.
School District Details
- Oxnard Union High School District
- Per-Pupil Spending: $8,614
- Graduation Rate: 100.0%
- Dropout Rate: 4.9%
- Students Per Teacher: 25.8
- Enrolled Students: 16,819
Faculty Details and Student Enrollment
Students and Faculty
- Total Students Enrolled: 2,205
- Total Full Time "Equivalent" Teachers: 89.6
- Average Student-To-Teacher Ratio: 24.6
Students Gender Breakdown
- Males: 1,157 (52.5%)
- Females: 1,048 (47.5%)
Free Lunch Student Eligibility Breakdown
- Eligible for Reduced Lunch: 122 (5.5%)
- Eligible for Free Lunch: 847 (38.4%)
- Eligible for Either Reduced or Free Lunch: 969 (43.9%)
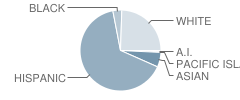
Student Enrollment Distribution by Race / Ethnicity

| Number | Percent | |
|---|---|---|
| American Indian | 13 | 0.6% |
| Black | 80 | 3.6% |
| Asian | 131 | 5.9% |
| Hispanic | 1,426 | 64.7% |
| White | 536 | 24.3% |
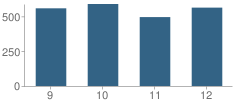
Number of Students Per Grade

| Number | Percent | |
|---|---|---|
| 9th Grade | 558 | 25.3% |
| 10th Grade | 589 | 26.7% |
| 11th Grade | 495 | 22.4% |
| 12th Grade | 563 | 25.5% |
Graduates Information (2010)
Graduation Rate
School:
86.7%
District:
84.3%
State:
78.6%
Teacher Education Background (2009)
Percent With Master's Degree
School:
14.2%
District:
13.6%
Percent With Bachelor's Degree
School:
16.8%
District:
4.5%
Teacher Credentials & Experience (2009)
Percent of Teachers With Emergency Credentials: 1.1%
Percent of Teachers With Credentials: 94.7%
Number of Certificated Staff: 113.0
Average Number of Years of Teacher Experience: 16.0
Average Age
School:
44.0
District:
54.3
Source: CA Department of Education, Source: NCES 2009-2010
School Ratings and Reviews
Be The First To Review Rio Mesa High School!
Sponsored Links
Test Scores and Performance Information
Overall School Rating
How is this determined?
The overall school rating shows that Rio Mesa High School performed on average about the same as other schools across the state on CST state exams in the following subjects:
- CST Algebra I
- CST Algebra II
- CST Biology
- CST Chemistry
- CST Earth Science
- CST English-Language Arts
- CST General Mathematics
- CST Geometry
- CST Integrated/Coordinated Science
- CST Science
- CST Summative High School Math
- CST U.S. History
- CST World History
AYP Results (2010)
Overall AYP Met: No
ELA AYP Met: No
Math AYP Met: No
Program Improvement (PI) Requirement Under NCLB (2010)
First Year PI Requirement was Implemented: 2009-2010
School's Placement Under NCLB: Year 2
ACT Exam Results (2009)
Percent of Students Taking ACT Exam: 18.1%
Average Combined Score: 23.5
Percent Scoring At or Above 21: 63.6%
SAT Exam Results (2009)
Percent of Students Taking SAT Exam: 25.2%
Average Combined Score: 1,574.1
Critical Reading Average: 527.5
Math Average: 535.2
Writing Average: 511.4
Percent Scoring At or Above 1500: 58.0%
CST - Test Proficiency by Grade and Subject
Grade 9 - % of students at or above proficiency
| School | District | State | |
|---|---|---|---|
| CST Algebra I Test | |||
| 2010 | 31.0% | 23.0% | 22.0% |
| 2009 | 24.0% | 19.0% | 21.0% |
| 2008 | 23.0% | 26.0% | 18.0% |
| CST Algebra II Test | |||
| 2010 | 87.0% | 72.0% | 69.0% |
| 2009 | 77.0% | 71.0% | 65.0% |
| CST Earth Science Test | |||
| 2010 | 38.0% | 36.0% | 35.0% |
| 2009 | 27.0% | 28.0% | 29.0% |
| CST English-Language Arts Test | |||
| 2010 | 51.0% | 50.0% | 54.0% |
| 2009 | 50.0% | 46.0% | 50.0% |
| 2008 | 49.0% | 44.0% | 49.0% |
| CST General Mathematics Test | |||
| 2010 | 15.0% | 15.0% | 17.0% |
| 2009 | 17.0% | 10.0% | 17.0% |
| 2008 | 18.0% | 18.0% | 18.0% |
| CST Geometry Test | |||
| 2010 | 57.0% | 54.0% | 46.0% |
| 2009 | 53.0% | 50.0% | 47.0% |
| 2008 | 45.0% | 46.0% | 43.0% |
| CST Integrated/Coordinated Science Test | |||
| 2010 | 87.0% | 32.0% | 19.0% |
| 2009 | 79.0% | 29.0% | 15.0% |
| 2008 | 14.0% | 11.0% | 5.0% |
| CST Chemistry Test | |||
| 2008 | 27.0% | 49.0% | 44.0% |
Grade 10 - % of students at or above proficiency
| School | District | State | |
|---|---|---|---|
| CST Algebra I Test | |||
| 2010 | 14.0% | 17.0% | 12.0% |
| 2009 | 12.0% | 14.0% | 11.0% |
| 2008 | 4.0% | 8.0% | 9.0% |
| CST Algebra II Test | |||
| 2010 | 54.0% | 42.0% | 40.0% |
| 2009 | 45.0% | 42.0% | 37.0% |
| 2008 | 37.0% | 32.0% | 36.0% |
| CST Biology Test | |||
| 2010 | 38.0% | 35.0% | 38.0% |
| 2009 | 46.0% | 37.0% | 34.0% |
| 2008 | 46.0% | 36.0% | 35.0% |
| CST English-Language Arts Test | |||
| 2010 | 40.0% | 42.0% | 45.0% |
| 2009 | 39.0% | 41.0% | 44.0% |
| 2008 | 42.0% | 37.0% | 41.0% |
| CST Geometry Test | |||
| 2010 | 11.0% | 11.0% | 14.0% |
| 2009 | 11.0% | 14.0% | 14.0% |
| 2008 | 10.0% | 10.0% | 12.0% |
| CST Science Test | |||
| 2010 | 45.0% | 41.0% | 46.0% |
| 2009 | 55.0% | 45.0% | 44.0% |
| 2008 | 47.0% | 38.0% | 40.0% |
| CST World History Test | |||
| 2010 | 36.0% | 38.0% | 42.0% |
| 2009 | 38.0% | 35.0% | 38.0% |
| 2008 | 36.0% | 31.0% | 33.0% |
| CST Integrated/Coordinated Science Test | |||
| 2008 | 6.0% | 2.0% | 7.0% |
Grade 11 - % of students at or above proficiency
| School | District | State | |
|---|---|---|---|
| CST Algebra I Test | |||
| 2010 | 15.0% | 21.0% | 8.0% |
| 2009 | 11.0% | 16.0% | 8.0% |
| 2008 | 2.0% | 5.0% | 5.0% |
| CST Algebra II Test | |||
| 2010 | 10.0% | 16.0% | 14.0% |
| 2009 | 12.0% | 13.0% | 12.0% |
| 2008 | 9.0% | 7.0% | 11.0% |
| CST Biology Test | |||
| 2010 | 38.0% | 28.0% | 46.0% |
| 2009 | 31.0% | 23.0% | 41.0% |
| 2008 | 41.0% | 25.0% | 39.0% |
| CST Chemistry Test | |||
| 2010 | 54.0% | 42.0% | 30.0% |
| 2009 | 50.0% | 39.0% | 27.0% |
| 2008 | 59.0% | 38.0% | 25.0% |
| CST Earth Science Test | |||
| 2010 | 29.0% | 27.0% | 32.0% |
| 2009 | 15.0% | 20.0% | 26.0% |
| 2008 | 16.0% | 19.0% | 28.0% |
| CST English-Language Arts Test | |||
| 2010 | 38.0% | 39.0% | 42.0% |
| 2009 | 40.0% | 36.0% | 40.0% |
| 2008 | 40.0% | 31.0% | 37.0% |
| CST Summative High School Math Test | |||
| 2010 | 53.0% | 47.0% | 50.0% |
| 2009 | 47.0% | 41.0% | 47.0% |
| 2008 | 43.0% | 38.0% | 43.0% |
| CST U.S. History Test | |||
| 2010 | 47.0% | 43.0% | 45.0% |
| 2009 | 48.0% | 40.0% | 44.0% |
| 2008 | 38.0% | 31.0% | 38.0% |
| CST Geometry Test | |||
| 2009 | 2.0% | 6.0% | 7.0% |
| 2008 | 3.0% | 4.0% | 6.0% |
End of Course - % of students at or above proficiency
| School | District | State | |
|---|---|---|---|
| CST Algebra I Test | |||
| 2010 | 20.0% | 21.0% | 31.0% |
| 2009 | 15.0% | 17.0% | 28.0% |
| 2008 | 9.0% | 14.0% | 25.0% |
| CST Algebra II Test | |||
| 2010 | 42.0% | 31.0% | 31.0% |
| 2009 | 33.0% | 30.0% | 28.0% |
| 2008 | 27.0% | 20.0% | 27.0% |
| CST Biology Test | |||
| 2010 | 38.0% | 35.0% | 46.0% |
| 2009 | 44.0% | 34.0% | 42.0% |
| 2008 | 45.0% | 34.0% | 42.0% |
| CST Chemistry Test | |||
| 2010 | 54.0% | 44.0% | 38.0% |
| 2009 | 50.0% | 39.0% | 36.0% |
| 2008 | 48.0% | 39.0% | 32.0% |
| CST Earth Science Test | |||
| 2010 | 36.0% | 34.0% | 33.0% |
| 2009 | 26.0% | 26.0% | 28.0% |
| 2008 | 16.0% | 26.0% | 28.0% |
| CST General Mathematics Test | |||
| 2010 | 15.0% | 15.0% | 27.0% |
| 2009 | 17.0% | 10.0% | 26.0% |
| 2008 | 18.0% | 18.0% | 27.0% |
| CST Geometry Test | |||
| 2010 | 26.0% | 25.0% | 27.0% |
| 2009 | 28.0% | 25.0% | 26.0% |
| 2008 | 20.0% | 22.0% | 24.0% |
| CST Integrated/Coordinated Science Test | |||
| 2010 | 68.0% | 28.0% | 16.0% |
| 2009 | 79.0% | 28.0% | 13.0% |
| 2008 | 14.0% | 11.0% | 11.0% |
| CST Summative High School Math Test | |||
| 2010 | 56.0% | 49.0% | 54.0% |
| 2009 | 50.0% | 43.0% | 50.0% |
| 2008 | 44.0% | 38.0% | 47.0% |
| CST World History Test | |||
| 2010 | 36.0% | 37.0% | 41.0% |
| 2009 | 37.0% | 35.0% | 38.0% |
| 2008 | 35.0% | 30.0% | 33.0% |
Source: CA Department of Education 2009-2010
School Map and Similar Schools Nearby
Click to Activate Map of Nearby School Campuses
Private
Public
This School
Similar Schools Nearby
| Buena High School 9-12 | 2,197 Students | 4.3 miles away | ![]() 1 out of 5 | |
| Foothill Technology High School 9-12 | 921 Students | 4.8 miles away | Not Yet Rated | |
| Channel Islands High School 9-12 | 2,761 Students | 5.8 miles away | Not Yet Rated | |
| E. O. Green Junior High School 6-8 | 966 Students | 6.4 miles away | Not Yet Rated | |
| Ocean View Junior High School 6-8 | 795 Students | 6.5 miles away | ![]() 5 out of 5 | |
| Charles Blackstock Junior High School 6-8 | 1,276 Students | 6.5 miles away | ![]() 5 out of 5 | |
| Hueneme High School 9-12 | 2,191 Students | 6.6 miles away | ![]() 2.5 out of 5 | |
| Ventura High School 9-12 | 2,105 Students | 7.1 miles away | Not Yet Rated | |
| Adolfo Camarillo High School 9-12 | 2,401 Students | 8.3 miles away | ![]() 5 out of 5 | |
| Santa Paula High School 9-12 | 1,524 Students | 8.4 miles away | Not Yet Rated | |
Compare This School To Nearby Schools ->
School Community Forum

Join a discussion about Rio Mesa High School and talk to others in the community including students, parents, teachers, and administrators.
Popular Discussion Topics
- Admissions and Registration Questions (e.g. Dress Code and Discipline Policy)
- School Calendar and Upcoming Events (e.g. Graduation)
- After School Programs, Extracurricular Activities, and Athletics (e.g. Football)
- News and Announcements (e.g. Yearbook and Class Supply List Details)
- Graduate and Alumni Events (e.g. Organizing Class Reunions)
Navigation
Can't Find What You Are Looking For?
Rankings
Nearby Cities
Sponsored Links
K-12 Articles
Does Your Child's Teacher Make a Difference
School improvement is always in the news. Teachers demand smaller class sizes. The government calls...
Helping Your Learning Disabled Child
Thousands of children in America struggle to learn on a daily basis. Many of them have invisible...
Your Child and School Corporal Punishment
Your child comes home at the end of the school day with a huge bruise on his upper arm. When you...


