Pacific Union Elementary School
Rating
Not Available
Not Available

No Reviews Yet
Find Old Friends From Pacific Union Elementary School
Use the form below to search for alumni from Pacific Union Elementary School.
School Description
School Summary and Highlights
- Enrolls 488 elementary school students from grades KG-8
- Ranks 664th out of 2,050 middle schools in CA.
- 2010 Overall School AYP Met Status: Yes
Additional Contact Information
- Mailing Address: 3001 Janes Rd., Arcata, CA 95521
School Operational Details
- Title I EligibleAll students of this school are eligible for participation in authorized programs.
School District Details
- Pacific Union Elementary School District
- Per-Pupil Spending: $7,111
- Students Per Teacher: 20.2
- Enrolled Students: 528
Faculty Details and Student Enrollment
Students and Faculty
- Total Students Enrolled: 488
- Total Full Time "Equivalent" Teachers: 23.6
- Average Student-To-Teacher Ratio: 20.7
Students Gender Breakdown
- Males: 226 (46.3%)
- Females: 262 (53.7%)
Free Lunch Student Eligibility Breakdown
- Eligible for Reduced Lunch: 30 (6.1%)
- Eligible for Free Lunch: 205 (42.0%)
- Eligible for Either Reduced or Free Lunch: 235 (48.2%)
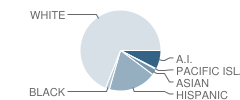
Student Enrollment Distribution by Race / Ethnicity
| Number | Percent | |
|---|---|---|
| American Indian | 36 | 7.4% |
| Black | 8 | 1.6% |
| Asian | 12 | 2.5% |
| Hispanic | 91 | 18.6% |
| White | 325 | 66.6% |
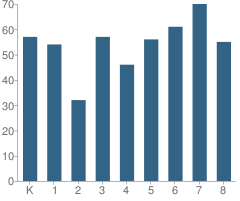
Number of Students Per Grade
| Number | Percent | |
|---|---|---|
| Kindergarten | 57 | 11.7% |
| 1st Grade | 54 | 11.1% |
| 2nd Grade | 32 | 6.6% |
| 3rd Grade | 57 | 11.7% |
| 4th Grade | 46 | 9.4% |
| 5th Grade | 56 | 11.5% |
| 6th Grade | 61 | 12.5% |
| 7th Grade | 70 | 14.3% |
| 8th Grade | 55 | 11.3% |
Teacher Education Background (2009)
Percent With Master's Degree: 3.4%
Teacher Credentials & Experience (2009)
Percent of Teachers With Credentials: 100.0%
Number of Certificated Staff: 29.0
Average Number of Years of Teacher Experience: 16.2
Average Age: 45.8
Source: CA Department of Education, Source: NCES 2009-2010
School Ratings and Reviews
Be The First To Review Pacific Union Elementary School!
School Map and Similar Schools Nearby
Click to Activate Map of Nearby School Campuses
Private
Public
This School
Similar Schools Nearby
| Arcata Elementary School KG-5 | 292 Students | 1.0 miles away | Not Yet Rated | |
| Morris Elementary School KG-5 | 272 Students | 3.7 miles away |  5 out of 5 | |
| Fieldbrook Elementary School KG-8 | 115 Students | 5.1 miles away | Not Yet Rated | |
| Blue Lake Elementary School KG-8 | 150 Students | 5.4 miles away | Not Yet Rated | |
| Dow's Prairie Elementary School KG-5 | 489 Students | 5.7 miles away | Not Yet Rated | |
| Peninsula Union Elementary School KG-8 | 21 Students | 6.9 miles away | 5 out of 5 | - |
| Lafayette Elementary School KG-6 | 424 Students | 7.2 miles away |  4 out of 5 | |
| Freshwater Elementary School KG-6 | 269 Students | 7.4 miles away | Not Yet Rated | |
| Maple Creek Elementary School KG-8 | 11 Students | 8.2 miles away | Not Yet Rated | - |
| Washington Elementary School KG-6 | 507 Students | 8.4 miles away | Not Yet Rated | |
Compare This School To Nearby Schools ->
School Community Forum

Join a discussion about Pacific Union Elementary School and talk to others in the community including students, parents, teachers, and administrators.
Popular Discussion Topics
- Admissions and Registration Questions (e.g. Dress Code and Discipline Policy)
- School Calendar and Upcoming Events (e.g. Graduation)
- After School Programs, Extracurricular Activities, and Athletics (e.g. Football)
- News and Announcements (e.g. Yearbook and Class Supply List Details)
- Graduate and Alumni Events (e.g. Organizing Class Reunions)
Navigation
Can't Find What You Are Looking For?
Rankings
Nearby Cities
Sponsored Links
K-12 Articles

Hurt: A Book Report
My last book report was over 15 years ago, and I'm a bit rusty, but here goes (Don't forget: book...
My last book report was over 15 years ago, and I'm a bit rusty, but here goes (Don't forget: book...

Helping Your Learning Disabled Child
Thousands of children in America struggle to learn on a daily basis. Many of them have invisible...
Thousands of children in America struggle to learn on a daily basis. Many of them have invisible...

Does Your Child's Teacher Make a Difference
School improvement is always in the news. Teachers demand smaller class sizes. The government calls...
School improvement is always in the news. Teachers demand smaller class sizes. The government calls...