Desert Hot Springs High School
65850 Pierson Blvd, Desert Hot Springs, CA 92240 | (760) 288-7000
- Grades: 9-12
- Student Enrollment: 1,935

3 out of 5 | 1 Review
Find Old Friends From Desert Hot Springs High School
Use the form below to search for alumni from Desert Hot Springs High School.
School Description
School Summary and Highlights
- Enrolls 1,935 high school students from grades 9-12
- Ranks 1022nd out of 1,197 high schools in CA.
- 2010 Overall School AYP Met Status: No
Additional Contact Information
- Mailing Address: 65850 Pierson Blvd., Desert Hot Springs, CA 92240
School Operational Details
- Title I EligibleAll students of this school are eligible for participation in authorized programs.
School District Details
- Palm Springs Unified School District
- Per-Pupil Spending: $8,767
- Graduation Rate: 66.8%
- Dropout Rate: 3.3%
- Students Per Teacher: 23.6
- Enrolled Students: 23,929
Faculty Details and Student Enrollment
Students and Faculty
- Total Students Enrolled: 1,935
- Total Full Time "Equivalent" Teachers: 80.1
- Average Student-To-Teacher Ratio: 24.2
Students Gender Breakdown
- Males: 985 (50.9%)
- Females: 950 (49.1%)
Free Lunch Student Eligibility Breakdown
- Eligible for Reduced Lunch: 195 (10.1%)
- Eligible for Free Lunch: 1,452 (75.0%)
- Eligible for Either Reduced or Free Lunch: 1,647 (85.1%)
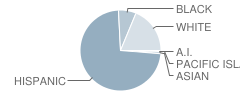
Student Enrollment Distribution by Race / Ethnicity

| Number | Percent | |
|---|---|---|
| American Indian | 10 | 0.5% |
| Black | 138 | 7.1% |
| Asian | 14 | 0.7% |
| Hispanic | 1,400 | 72.4% |
| White | 361 | 18.7% |
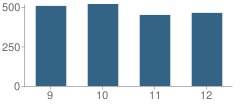
Number of Students Per Grade

| Number | Percent | |
|---|---|---|
| 9th Grade | 506 | 26.1% |
| 10th Grade | 518 | 26.8% |
| 11th Grade | 449 | 23.2% |
| 12th Grade | 462 | 23.9% |
Graduates Information (2010)
Graduation Rate
School:
71.9%
District:
78.3%
State:
78.6%
Teacher Education Background (2009)
Percent With Ph.D.
School:
3.2%
District:
11.0%
Percent With Master's Degree
School:
33.7%
District:
50.0%
Percent With Bachelor's Degree
School:
20.0%
District:
5.0%
Teacher Credentials & Experience (2009)
Percent of Teachers With Emergency Credentials: 9.3%
Percent of Teachers With Credentials: 88.4%
Number of Certificated Staff: 95.0
Average Number of Years of Teacher Experience: 9.6
Average Age
School:
40.1
District:
47.8
Source: CA Department of Education, Source: NCES 2009-2010
Sponsored Links
Test Scores and Performance Information
Overall School Rating
How is this determined?
The overall school rating shows that Desert Hot Springs High School performed on average worse than many other schools across the state on CST state exams in the following subjects:
- CST Algebra I
- CST Algebra II
- CST Biology
- CST Chemistry
- CST Earth Science
- CST English-Language Arts
- CST General Mathematics
- CST Geometry
- CST Integrated Math 2
- CST Physics
- CST Science
- CST Summative High School Math
- CST U.S. History
- CST World History
AYP Results (2010)
Overall AYP Met: No
ELA AYP Met: No
Math AYP Met: No
Program Improvement (PI) Requirement Under NCLB (2010)
First Year PI Requirement was Implemented: 2004-2005
School's Placement Under NCLB: Year 5
ACT Exam Results (2009)
Percent of Students Taking ACT Exam: 9.6%
Average Combined Score: 17.8
Percent Scoring At or Above 21: 20.5%
SAT Exam Results (2009)
Percent of Students Taking SAT Exam: 23.9%
Average Combined Score: 1,248.6
Critical Reading Average: 425.1
Math Average: 411.0
Writing Average: 412.5
Percent Scoring At or Above 1500: 17.4%
CST - Test Proficiency by Grade and Subject
Grade 9 - % of students at or above proficiency
| School | District | State | |
|---|---|---|---|
| CST Algebra I Test | |||
| 2010 | 6.0% | 7.0% | 22.0% |
| 2009 | 6.0% | 9.0% | 21.0% |
| 2008 | 2.0% | 10.0% | 18.0% |
| CST Biology Test | |||
| 2010 | 68.0% | 78.0% | 55.0% |
| 2009 | 73.0% | 70.0% | 51.0% |
| 2008 | 52.0% | 68.0% | 52.0% |
| CST Earth Science Test | |||
| 2010 | 23.0% | 25.0% | 35.0% |
| 2009 | 20.0% | 21.0% | 29.0% |
| 2008 | 19.0% | 20.0% | 31.0% |
| CST English-Language Arts Test | |||
| 2010 | 34.0% | 44.0% | 54.0% |
| 2009 | 30.0% | 45.0% | 50.0% |
| 2008 | 29.0% | 37.0% | 49.0% |
| CST Geometry Test | |||
| 2010 | 26.0% | 29.0% | 46.0% |
| 2009 | 30.0% | 32.0% | 47.0% |
| 2008 | 4.0% | 19.0% | 43.0% |
| CST General Mathematics Test | |||
| 2008 | 4.0% | 4.0% | 18.0% |
Grade 10 - % of students at or above proficiency
| School | District | State | |
|---|---|---|---|
| CST Algebra I Test | |||
| 2010 | 1.0% | 2.0% | 12.0% |
| 2009 | 5.0% | 5.0% | 11.0% |
| 2008 | 2.0% | 3.0% | 9.0% |
| CST Algebra II Test | |||
| 2010 | 34.0% | 29.0% | 40.0% |
| 2009 | 5.0% | 21.0% | 37.0% |
| 2008 | 7.0% | 15.0% | 36.0% |
| CST Biology Test | |||
| 2010 | 27.0% | 29.0% | 38.0% |
| 2009 | 15.0% | 21.0% | 34.0% |
| 2008 | 13.0% | 20.0% | 35.0% |
| CST Chemistry Test | |||
| 2010 | 49.0% | 60.0% | 47.0% |
| 2009 | 20.0% | 53.0% | 44.0% |
| 2008 | 9.0% | 44.0% | 41.0% |
| CST Earth Science Test | |||
| 2010 | 9.0% | 13.0% | 29.0% |
| CST English-Language Arts Test | |||
| 2010 | 29.0% | 38.0% | 45.0% |
| 2009 | 21.0% | 33.0% | 44.0% |
| 2008 | 21.0% | 31.0% | 41.0% |
| CST Geometry Test | |||
| 2010 | 2.0% | 3.0% | 14.0% |
| 2009 | 3.0% | 5.0% | 14.0% |
| 2008 | 2.0% | 3.0% | 12.0% |
| CST Science Test | |||
| 2010 | 39.0% | 43.0% | 46.0% |
| 2009 | 27.0% | 37.0% | 44.0% |
| 2008 | 21.0% | 31.0% | 40.0% |
| CST Summative High School Math Test | |||
| 2010 | 62.0% | 67.0% | 75.0% |
| CST World History Test | |||
| 2010 | 26.0% | 26.0% | 42.0% |
| 2009 | 14.0% | 22.0% | 38.0% |
| 2008 | 12.0% | 19.0% | 33.0% |
Grade 11 - % of students at or above proficiency
| School | District | State | |
|---|---|---|---|
| CST Algebra II Test | |||
| 2010 | 10.0% | 7.0% | 14.0% |
| 2009 | 4.0% | 7.0% | 12.0% |
| CST Biology Test | |||
| 2010 | 24.0% | 37.0% | 46.0% |
| 2009 | 18.0% | 34.0% | 41.0% |
| 2008 | 25.0% | 32.0% | 39.0% |
| CST Chemistry Test | |||
| 2010 | 8.0% | 23.0% | 30.0% |
| 2009 | 5.0% | 21.0% | 27.0% |
| 2008 | 4.0% | 21.0% | 25.0% |
| CST Earth Science Test | |||
| 2010 | 6.0% | 28.0% | 32.0% |
| CST English-Language Arts Test | |||
| 2010 | 22.0% | 31.0% | 42.0% |
| 2009 | 19.0% | 30.0% | 40.0% |
| 2008 | 22.0% | 28.0% | 37.0% |
| CST Geometry Test | |||
| 2010 | 2.0% | 2.0% | 6.0% |
| 2009 | 2.0% | 2.0% | 7.0% |
| 2008 | 1.0% | 4.0% | 6.0% |
| CST Physics Test | |||
| 2010 | 18.0% | 65.0% | 53.0% |
| 2009 | 5.0% | 24.0% | 50.0% |
| 2008 | 2.0% | 15.0% | 47.0% |
| CST Summative High School Math Test | |||
| 2010 | 17.0% | 23.0% | 50.0% |
| 2009 | 14.0% | 32.0% | 47.0% |
| 2008 | 22.0% | 25.0% | 43.0% |
| CST U.S. History Test | |||
| 2010 | 26.0% | 31.0% | 45.0% |
| 2009 | 25.0% | 32.0% | 44.0% |
| 2008 | 15.0% | 23.0% | 38.0% |
| CST World History Test | |||
| 2010 | 13.0% | 11.0% | 15.0% |
| 2009 | 15.0% | 11.0% | 11.0% |
| 2008 | 9.0% | 6.0% | 9.0% |
| CST Algebra I Test | |||
| 2009 | 2.0% | 4.0% | 8.0% |
| CST Integrated Math 2 Test | |||
| 2008 | 7.0% | 4.0% | 13.0% |
End of Course - % of students at or above proficiency
| School | District | State | |
|---|---|---|---|
| CST Algebra I Test | |||
| 2010 | 4.0% | 19.0% | 31.0% |
| 2009 | 5.0% | 15.0% | 28.0% |
| 2008 | 2.0% | 21.0% | 25.0% |
| CST Algebra II Test | |||
| 2010 | 20.0% | 21.0% | 31.0% |
| 2009 | 6.0% | 17.0% | 28.0% |
| 2008 | 3.0% | 11.0% | 27.0% |
| CST Biology Test | |||
| 2010 | 30.0% | 40.0% | 46.0% |
| 2009 | 20.0% | 34.0% | 42.0% |
| 2008 | 18.0% | 32.0% | 42.0% |
| CST Chemistry Test | |||
| 2010 | 16.0% | 39.0% | 38.0% |
| 2009 | 8.0% | 34.0% | 36.0% |
| 2008 | 6.0% | 33.0% | 32.0% |
| CST Earth Science Test | |||
| 2010 | 21.0% | 24.0% | 33.0% |
| 2009 | 18.0% | 22.0% | 28.0% |
| 2008 | 18.0% | 23.0% | 28.0% |
| CST Geometry Test | |||
| 2010 | 5.0% | 10.0% | 27.0% |
| 2009 | 7.0% | 17.0% | 26.0% |
| 2008 | 2.0% | 10.0% | 24.0% |
| CST Physics Test | |||
| 2010 | 18.0% | 64.0% | 49.0% |
| 2009 | 4.0% | 27.0% | 46.0% |
| 2008 | 2.0% | 15.0% | 43.0% |
| CST Summative High School Math Test | |||
| 2010 | 29.0% | 32.0% | 54.0% |
| 2009 | 22.0% | 34.0% | 50.0% |
| 2008 | 24.0% | 32.0% | 47.0% |
| CST World History Test | |||
| 2010 | 24.0% | 25.0% | 41.0% |
| 2009 | 15.0% | 21.0% | 38.0% |
| 2008 | 12.0% | 18.0% | 33.0% |
| CST General Mathematics Test | |||
| 2008 | 4.0% | 32.0% | 27.0% |
| CST Integrated Math 2 Test | |||
| 2008 | 6.0% | 4.0% | 25.0% |
Source: CA Department of Education 2009-2010
School Map and Similar Schools Nearby
Click to Activate Map of Nearby School Campuses
Private
Public
This School
Similar Schools Nearby
| Palm Springs High School 9-12 | 2,158 Students | 9.8 miles away | Not Yet Rated | |
| Cathedral City High School 9-12 | 2,849 Students | 11.6 miles away | Not Yet Rated | |
| Yucca Valley High School 9-12 | 1,603 Students | 11.7 miles away | ![]() 5 out of 5 | |
| La Contenta Junior High School 7-8 | 871 Students | 14.0 miles away | Not Yet Rated | |
| Palm Desert High School 9-12 | 2,103 Students | 18.2 miles away | Not Yet Rated | |
| Banning High School 9-12 | 1,170 Students | 21.1 miles away | Not Yet Rated | |
| La Quinta High School 9-12 | 2,985 Students | 21.6 miles away | Not Yet Rated | |
| Shadow Hills High School 9-12 | 640 Students | 21.6 miles away | Not Yet Rated | - |
| Indio High School 9-12 | 2,447 Students | 23.3 miles away | Not Yet Rated | |
| Beaumont High School 9-12 | 2,305 Students | 26.7 miles away | ![]() 3 out of 5 | |
Compare This School To Nearby Schools ->
School Community Forum

Join a discussion about Desert Hot Springs High School and talk to others in the community including students, parents, teachers, and administrators.
Popular Discussion Topics
- Admissions and Registration Questions (e.g. Dress Code and Discipline Policy)
- School Calendar and Upcoming Events (e.g. Graduation)
- After School Programs, Extracurricular Activities, and Athletics (e.g. Football)
- News and Announcements (e.g. Yearbook and Class Supply List Details)
- Graduate and Alumni Events (e.g. Organizing Class Reunions)
Navigation
Can't Find What You Are Looking For?
Rankings
Nearby Cities
Sponsored Links
K-12 Articles
Help Your Child Achieve Success in Middle School
Middle school is for children between the ages of 10 and 14 years. At this time children begin to...
Keep Your Licensed Teen Safe This Summer
Every year hundreds of teenage drivers lose their lives in motor vehicle accidents. Statistics show...
Assisting Students to Overcome Test Anxiety
Every human copes with anxiety at one time or another. It is a basic emotion that we feel when...


(3 / 5) 
