Jane Lathrop Stanford Middle School
Rating
Not Available
Not Available

5 out of 5 | 1 Review
Find Old Friends From Jane Lathrop Stanford Middle School
Use the form below to search for alumni from Jane Lathrop Stanford Middle School.
School Description
School Summary and Highlights
- Enrolls 973 middle school students from grades 6-8
- Ranks 46th out of 2,050 middle schools in CA.
- 2010 Overall School AYP Met Status: Yes
Additional Contact Information
- Mailing Address: 480 East Meadow Dr., Palo Alto, CA 94306
School District Details
- Palo Alto Unified School District
- Per-Pupil Spending: $13,568
- Graduation Rate: 96.6%
- Dropout Rate: 1.0%
- Students Per Teacher: 17.7
- Enrolled Students: 11,661
Faculty Details and Student Enrollment
Students and Faculty
- Total Students Enrolled: 973
- Total Full Time "Equivalent" Teachers: 53.1
- Average Student-To-Teacher Ratio: 18.3
Students Gender Breakdown
- Males: 483 (49.6%)
- Females: 490 (50.4%)
Free Lunch Student Eligibility Breakdown
- Eligible for Reduced Lunch: 31 (3.2%)
- Eligible for Free Lunch: 75 (7.7%)
- Eligible for Either Reduced or Free Lunch: 106 (10.9%)
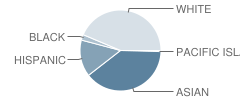
Student Enrollment Distribution by Race / Ethnicity
| Number | Percent | |
|---|---|---|
| American Indian | - | - |
| Black | 20 | 2.1% |
| Asian | 349 | 35.9% |
| Hispanic | 131 | 13.5% |
| White | 390 | 40.1% |
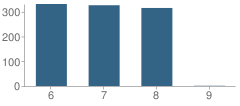
Number of Students Per Grade
| Number | Percent | |
|---|---|---|
| 6th Grade | 331 | 34.0% |
| 7th Grade | 326 | 33.5% |
| 8th Grade | 315 | 32.4% |
| 9th Grade | 1 | 0.1% |
Teacher Education Background (2009)
Percent With Ph.D.
School:
2.9%
District:
14.6%
Percent With Master's Degree: 2.9%
Percent With Bachelor's Degree
School:
2.9%
District:
2.1%
Teacher Credentials & Experience (2009)
Percent of Teachers With Emergency Credentials: 1.7%
Percent of Teachers With Credentials: 100.0%
Number of Certificated Staff: 68.0
Average Number of Years of Teacher Experience: 11.7
Average Age
School:
41.6
District:
51.8
Source: CA Department of Education, Source: NCES 2009-2010
School Ratings and Reviews
Overall Rating: 5

5 out of 5 | 1 Review
The Overall Rating is the school's average rating from parents, students, school faculty and staff. The highest rating is five apples and the lowest is one apple.
Share Your Review About This School
1 review for Jane Lathrop Stanford Middle School
- Reviewed by Student on August 07, 2007
- Rating:
 (5 / 5) Flag as inappropriate
 - Jane Lathrop Middle school is an excellent school it was ranked 17th in California. Classrooms usually are about 20. Each student has 7 classes but there are only 6 periods a day. The teachers are GREAT! The school has high academic expectaions. Theirs is a heavy homework load. But other than that it is a GREAT SCHOOL!
School Map and Similar Schools Nearby
Click to Activate Map of Nearby School Campuses
Private
Public
This School
Similar Schools Nearby
| Terman Middle School 6-8 | 658 Students | 1.3 miles away | Not Yet Rated | |
| David Starr Jordan Middle School 6-8 | 959 Students | 1.4 miles away | Not Yet Rated | |
| Ardis G. Egan Intermediate School 7-8 | 534 Students | 1.8 miles away | Not Yet Rated | |
| Santa Rita Elementary School KG-6 | 523 Students | 2.0 miles away | Not Yet Rated | |
| Crittenden Middle School 6-8 | 584 Students | 2.0 miles away | Not Yet Rated | |
| Almond Elementary School KG-6 | 538 Students | 2.7 miles away | Not Yet Rated | |
| Edison-Brentwood Elementary School 6-8 | 210 Students | 2.8 miles away | Not Yet Rated | |
| Bullis-Purissima School KG-6 | 246 Students | 2.8 miles away | Not Yet Rated | |
| Isaac Newton Graham Middle School 6-8 | 696 Students | 3.3 miles away | Not Yet Rated | |
| Willow Oaks Elementary School KG-8 | 564 Students | 3.5 miles away |  5 out of 5 | |
Compare This School To Nearby Schools ->
School Community Forum

Join a discussion about Jane Lathrop Stanford Middle School and talk to others in the community including students, parents, teachers, and administrators.
Popular Discussion Topics
- Admissions and Registration Questions (e.g. Dress Code and Discipline Policy)
- School Calendar and Upcoming Events (e.g. Graduation)
- After School Programs, Extracurricular Activities, and Athletics (e.g. Football)
- News and Announcements (e.g. Yearbook and Class Supply List Details)
- Graduate and Alumni Events (e.g. Organizing Class Reunions)
Navigation
Can't Find What You Are Looking For?
Rankings
Nearby Cities
Sponsored Links
K-12 Articles

Is Your Child's Teacher a Bully?
We've all heard about kids being bullied by peers. Kids taunt, tease, pull hair, shove and push...
We've all heard about kids being bullied by peers. Kids taunt, tease, pull hair, shove and push...

Adolescents, Sleep and Learning
Recently, adolescent's sleep habits have been in the news. Research has shown that adolescents need...
Recently, adolescent's sleep habits have been in the news. Research has shown that adolescents need...

Keep Your Licensed Teen Safe This Summer
Every year hundreds of teenage drivers lose their lives in motor vehicle accidents. Statistics show...
Every year hundreds of teenage drivers lose their lives in motor vehicle accidents. Statistics show...