John Muir High School

No Reviews Yet
Find Old Friends From John Muir High School
Use the form below to search for alumni from John Muir High School.
School Description
School Summary and Highlights
- Enrolls 1,157 high school students from grades 9-12
- Ranks 1126th out of 1,197 high schools in CA.
- 2010 Overall School AYP Met Status: No
Additional Contact Information
- Mailing Address: 1905 North Lincoln Ave., Pasadena, CA 91103
School District Details
- Pasadena Unified School District
- Per-Pupil Spending: $10,241
- Graduation Rate: 61.7%
- Dropout Rate: 5.7%
- Students Per Teacher: 20.7
- Enrolled Students: 19,928
Faculty Details and Student Enrollment
Students and Faculty
- Total Students Enrolled: 1,157
- Total Full Time "Equivalent" Teachers: 66.3
- Average Student-To-Teacher Ratio: 17.5
Students Gender Breakdown
- Males: 591 (51.1%)
- Females: 566 (48.9%)
Free Lunch Student Eligibility Breakdown
- Eligible for Reduced Lunch: 91 (7.9%)
- Eligible for Free Lunch: 796 (68.8%)
- Eligible for Either Reduced or Free Lunch: 887 (76.7%)
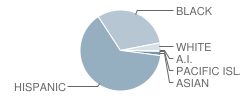
Student Enrollment Distribution by Race / Ethnicity

| Number | Percent | |
|---|---|---|
| American Indian | 4 | 0.3% |
| Black | 354 | 30.6% |
| Asian | 19 | 1.6% |
| Hispanic | 723 | 62.5% |
| White | 35 | 3.0% |
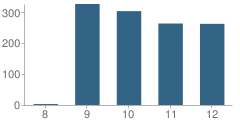
Number of Students Per Grade

| Number | Percent | |
|---|---|---|
| 8th Grade | 3 | 0.3% |
| 9th Grade | 326 | 28.2% |
| 10th Grade | 303 | 26.2% |
| 11th Grade | 263 | 22.7% |
| 12th Grade | 262 | 22.6% |
Graduates Information (2010)
Graduation Rate
School:
74.1%
District:
79.5%
State:
78.6%
Teacher Education Background (2009)
Percent With Ph.D.
School:
3.8%
District:
12.5%
Percent With Master's Degree
School:
24.4%
District:
20.3%
Percent With Bachelor's Degree
School:
17.9%
District:
3.1%
Teacher Credentials & Experience (2009)
Percent of Teachers With Emergency Credentials: 3.0%
Percent of Teachers With Credentials: 77.6%
Number of Certificated Staff: 78.0
Average Number of Years of Teacher Experience: 8.7
Average Age
School:
39.4
District:
47.8
Source: CA Department of Education, Source: NCES 2009-2010
School Ratings and Reviews
Be The First To Review John Muir High School!
Sponsored Links
Test Scores and Performance Information
Overall School Rating
How is this determined?
The overall school rating shows that John Muir High School performed on average much worse than most other schools across the state on CST state exams in the following subjects:
- CST Algebra I
- CST Algebra II
- CST Biology
- CST Chemistry
- CST Earth Science
- CST English-Language Arts
- CST General Mathematics
- CST Geometry
- CST Physics
- CST Science
- CST Summative High School Math
- CST U.S. History
- CST World History
AYP Results (2010)
Overall AYP Met: No
ELA AYP Met: No
Math AYP Met: No
ACT Exam Results (2009)
Percent of Students Taking ACT Exam: 21.2%
Average Combined Score: 17.3
Percent Scoring At or Above 21: 21.4%
SAT Exam Results (2009)
Percent of Students Taking SAT Exam: 49.2%
Average Combined Score: 1,236.2
Critical Reading Average: 417.9
Math Average: 411.9
Writing Average: 406.5
Percent Scoring At or Above 1500: 13.9%
CST - Test Proficiency by Grade and Subject
Grade 9 - % of students at or above proficiency
| School | District | State | |
|---|---|---|---|
| CST Algebra I Test | |||
| 2010 | 14.0% | 17.0% | 22.0% |
| 2009 | 13.0% | 12.0% | 21.0% |
| 2008 | 19.0% | 13.0% | 18.0% |
| CST Biology Test | |||
| 2010 | 16.0% | 35.0% | 55.0% |
| 2009 | 11.0% | 34.0% | 51.0% |
| 2008 | 18.0% | 35.0% | 52.0% |
| CST English-Language Arts Test | |||
| 2010 | 32.0% | 52.0% | 54.0% |
| 2009 | 25.0% | 43.0% | 50.0% |
| 2008 | 25.0% | 43.0% | 49.0% |
| CST Geometry Test | |||
| 2010 | 27.0% | 37.0% | 46.0% |
| 2009 | 46.0% | 32.0% | 47.0% |
| 2008 | 31.0% | 27.0% | 43.0% |
| CST Physics Test | |||
| 2010 | 17.0% | 17.0% | 40.0% |
| CST Earth Science Test | |||
| 2008 | 4.0% | 5.0% | 31.0% |
| CST General Mathematics Test | |||
| 2008 | 14.0% | 13.0% | 18.0% |
Grade 10 - % of students at or above proficiency
| School | District | State | |
|---|---|---|---|
| CST Algebra II Test | |||
| 2010 | 18.0% | 28.0% | 40.0% |
| 2009 | 37.0% | 28.0% | 37.0% |
| 2008 | 14.0% | 17.0% | 36.0% |
| CST Biology Test | |||
| 2010 | 6.0% | 19.0% | 38.0% |
| 2009 | 5.0% | 16.0% | 34.0% |
| 2008 | 9.0% | 13.0% | 35.0% |
| CST Chemistry Test | |||
| 2010 | 3.0% | 26.0% | 47.0% |
| 2009 | 15.0% | 21.0% | 44.0% |
| 2008 | 3.0% | 16.0% | 41.0% |
| CST English-Language Arts Test | |||
| 2010 | 23.0% | 41.0% | 45.0% |
| 2009 | 26.0% | 40.0% | 44.0% |
| 2008 | 22.0% | 35.0% | 41.0% |
| CST Geometry Test | |||
| 2010 | 2.0% | 8.0% | 14.0% |
| 2009 | 2.0% | 5.0% | 14.0% |
| 2008 | 2.0% | 3.0% | 12.0% |
| CST Science Test | |||
| 2010 | 18.0% | 36.0% | 46.0% |
| 2009 | 17.0% | 33.0% | 44.0% |
| 2008 | 14.0% | 27.0% | 40.0% |
| CST World History Test | |||
| 2010 | 20.0% | 37.0% | 42.0% |
| 2009 | 20.0% | 36.0% | 38.0% |
| 2008 | 14.0% | 29.0% | 33.0% |
| CST Algebra I Test | |||
| 2009 | 2.0% | 5.0% | 11.0% |
| 2008 | 4.0% | 5.0% | 9.0% |
| CST Earth Science Test | |||
| 2008 | 5.0% | 8.0% | 23.0% |
Grade 11 - % of students at or above proficiency
| School | District | State | |
|---|---|---|---|
| CST Algebra II Test | |||
| 2010 | 5.0% | 11.0% | 14.0% |
| 2009 | 1.0% | 6.0% | 12.0% |
| 2008 | 5.0% | 4.0% | 11.0% |
| CST Biology Test | |||
| 2010 | 20.0% | 48.0% | 46.0% |
| 2009 | 17.0% | 41.0% | 41.0% |
| 2008 | 23.0% | 28.0% | 39.0% |
| CST Chemistry Test | |||
| 2010 | 2.0% | 13.0% | 30.0% |
| 2009 | 4.0% | 10.0% | 27.0% |
| CST English-Language Arts Test | |||
| 2010 | 25.0% | 42.0% | 42.0% |
| 2009 | 22.0% | 36.0% | 40.0% |
| 2008 | 27.0% | 34.0% | 37.0% |
| CST Physics Test | |||
| 2010 | 11.0% | 39.0% | 53.0% |
| 2009 | 5.0% | 25.0% | 50.0% |
| 2008 | 8.0% | 25.0% | 47.0% |
| CST Summative High School Math Test | |||
| 2010 | 31.0% | 54.0% | 50.0% |
| 2009 | 14.0% | 36.0% | 47.0% |
| 2008 | 13.0% | 26.0% | 43.0% |
| CST U.S. History Test | |||
| 2010 | 32.0% | 48.0% | 45.0% |
| 2009 | 26.0% | 44.0% | 44.0% |
| 2008 | 27.0% | 39.0% | 38.0% |
| CST Geometry Test | |||
| 2009 | 2.0% | 3.0% | 7.0% |
| 2008 | 2.0% | 1.0% | 6.0% |
| CST World History Test | |||
| 2008 | 6.0% | 3.0% | 9.0% |
End of Course - % of students at or above proficiency
| School | District | State | |
|---|---|---|---|
| CST Algebra I Test | |||
| 2010 | 10.0% | 21.0% | 31.0% |
| 2009 | 9.0% | 19.0% | 28.0% |
| 2008 | 11.0% | 18.0% | 25.0% |
| CST Algebra II Test | |||
| 2010 | 8.0% | 23.0% | 31.0% |
| 2009 | 9.0% | 20.0% | 28.0% |
| 2008 | 9.0% | 15.0% | 27.0% |
| CST Biology Test | |||
| 2010 | 14.0% | 31.0% | 46.0% |
| 2009 | 10.0% | 29.0% | 42.0% |
| 2008 | 16.0% | 27.0% | 42.0% |
| CST Chemistry Test | |||
| 2010 | 3.0% | 23.0% | 38.0% |
| 2009 | 10.0% | 18.0% | 36.0% |
| 2008 | 3.0% | 17.0% | 32.0% |
| CST Geometry Test | |||
| 2010 | 4.0% | 19.0% | 27.0% |
| 2009 | 5.0% | 17.0% | 26.0% |
| 2008 | 6.0% | 13.0% | 24.0% |
| CST Physics Test | |||
| 2010 | 13.0% | 36.0% | 49.0% |
| 2009 | 5.0% | 25.0% | 46.0% |
| 2008 | 8.0% | 25.0% | 43.0% |
| CST Summative High School Math Test | |||
| 2010 | 30.0% | 61.0% | 54.0% |
| 2009 | 17.0% | 45.0% | 50.0% |
| 2008 | 15.0% | 34.0% | 47.0% |
| CST World History Test | |||
| 2010 | 20.0% | 36.0% | 41.0% |
| 2009 | 19.0% | 34.0% | 38.0% |
| 2008 | 13.0% | 28.0% | 33.0% |
| CST Earth Science Test | |||
| 2008 | 4.0% | 6.0% | 28.0% |
| CST General Mathematics Test | |||
| 2008 | 14.0% | 19.0% | 27.0% |
Source: CA Department of Education 2009-2010
School Map and Similar Schools Nearby
Click to Activate Map of Nearby School Campuses
Private
Public
This School
Similar Schools Nearby
| La Canada High School 7-12 | 2,185 Students | 1.3 miles away | Not Yet Rated | |
| Roosevelt Elementary School KG-12 | 305 Students | 1.8 miles away | ![]() 5 out of 5 | |
| Marshall Fundamental School 6-12 | 1,804 Students | 2.9 miles away | ![]() 4 out of 5 | |
| Blair High School 7-12 | 1,035 Students | 3.7 miles away | ![]() 5 out of 5 | |
| Pasadena High School 9-12 | 2,188 Students | 4.1 miles away | ![]() 5 out of 5 | |
| Glendale High School 9-12 | 2,967 Students | 4.7 miles away | ![]() 5 out of 5 | |
| South Pasadena High School 9-12 | 1,518 Students | 4.7 miles away | Not Yet Rated | |
| San Marino High School 9-12 | 1,146 Students | 5.1 miles away | Not Yet Rated | |
| Crescenta Valley High School 9-12 | 3,004 Students | 5.6 miles away | ![]() 5 out of 5 | |
| Alhambra High School 9-12 | 3,115 Students | 6.0 miles away | ![]() 3.5 out of 5 | |
Compare This School To Nearby Schools ->
School Community Forum

Join a discussion about John Muir High School and talk to others in the community including students, parents, teachers, and administrators.
Popular Discussion Topics
- Admissions and Registration Questions (e.g. Dress Code and Discipline Policy)
- School Calendar and Upcoming Events (e.g. Graduation)
- After School Programs, Extracurricular Activities, and Athletics (e.g. Football)
- News and Announcements (e.g. Yearbook and Class Supply List Details)
- Graduate and Alumni Events (e.g. Organizing Class Reunions)
Navigation
Can't Find What You Are Looking For?
Rankings
Nearby Cities
Sponsored Links
K-12 Articles
Helping Your Child Leave the Nest
It's all come down to this: Eighteen years of good times and bad, and now your baby bird is ready...
When Bad Report Cards Happen to Good Kids
It's mid-term season once again, and semester (or quarter or trimester) grades will be coming out...
Cutting Class
Depression is a very real problem for today's youth. When your spirit doesn't feel good, a lot of...


