Pasadena High School
2925 East Sierra Madre Blvd, Pasadena, CA 91107 | (626) 396-5880
- Grades: 9-12
- Student Enrollment: 2,188

5 out of 5 | 2 Reviews
Find Old Friends From Pasadena High School
Use the form below to search for alumni from Pasadena High School.
School Description
School Summary and Highlights
- Enrolls 2,188 high school students from grades 9-12
- Ranks 567th out of 1,197 high schools in CA.
- 2010 Overall School AYP Met Status: No
Additional Contact Information
- Mailing Address: 2925 East Sierra Madre Blvd., Pasadena, CA 91107
School District Details
- Pasadena Unified School District
- Per-Pupil Spending: $10,241
- Graduation Rate: 61.7%
- Dropout Rate: 5.7%
- Students Per Teacher: 20.7
- Enrolled Students: 19,928
Faculty Details and Student Enrollment
Students and Faculty
- Total Students Enrolled: 2,188
- Total Full Time "Equivalent" Teachers: 86.2
- Average Student-To-Teacher Ratio: 25.4
Students Gender Breakdown
- Males: 1,059 (48.4%)
- Females: 1,129 (51.6%)
Free Lunch Student Eligibility Breakdown
- Eligible for Reduced Lunch: 235 (10.7%)
- Eligible for Free Lunch: 1,080 (49.4%)
- Eligible for Either Reduced or Free Lunch: 1,315 (60.1%)
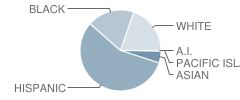
Student Enrollment Distribution by Race / Ethnicity

| Number | Percent | |
|---|---|---|
| American Indian | 1 | 0.05% |
| Black | 379 | 17.3% |
| Asian | 95 | 4.3% |
| Hispanic | 1,134 | 51.8% |
| White | 395 | 18.1% |
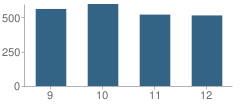
Number of Students Per Grade

| Number | Percent | |
|---|---|---|
| 9th Grade | 560 | 25.6% |
| 10th Grade | 596 | 27.2% |
| 11th Grade | 519 | 23.7% |
| 12th Grade | 513 | 23.4% |
Graduates Information (2010)
Graduation Rate
School:
84.9%
District:
79.5%
State:
78.6%
Teacher Education Background (2009)
Percent With Ph.D.
School:
4.7%
District:
12.5%
Percent With Master's Degree
School:
31.1%
District:
20.3%
Percent With Bachelor's Degree
School:
20.8%
District:
3.1%
Teacher Credentials & Experience (2009)
Percent of Teachers With Emergency Credentials: 6.5%
Percent of Teachers With Credentials: 82.8%
Number of Certificated Staff: 106.0
Average Number of Years of Teacher Experience: 14.7
Average Age
School:
45.9
District:
47.8
Source: CA Department of Education, Source: NCES 2009-2010
Sponsored Links
Test Scores and Performance Information
Overall School Rating
How is this determined?
The overall school rating shows that Pasadena High School performed on average about the same as other schools across the state on CST state exams in the following subjects:
- CST Algebra I
- CST Algebra II
- CST Biology
- CST Chemistry
- CST Earth Science
- CST English-Language Arts
- CST Geometry
- CST Integrated Math 1
- CST Integrated Math 2
- CST Integrated/Coordinated Science
- CST Physics
- CST Science
- CST Summative High School Math
- CST U.S. History
- CST World History
AYP Results (2010)
Overall AYP Met: No
ELA AYP Met: No
Math AYP Met: No
ACT Exam Results (2009)
Percent of Students Taking ACT Exam: 15.4%
Average Combined Score: 20.7
Percent Scoring At or Above 21: 50.7%
SAT Exam Results (2009)
Percent of Students Taking SAT Exam: 42.5%
Average Combined Score: 1,430.7
Critical Reading Average: 472.0
Math Average: 484.6
Writing Average: 474.2
Percent Scoring At or Above 1500: 38.6%
CST - Test Proficiency by Grade and Subject
Grade 9 - % of students at or above proficiency
| School | District | State | |
|---|---|---|---|
| CST Algebra I Test | |||
| 2010 | 21.0% | 17.0% | 22.0% |
| 2009 | 16.0% | 12.0% | 21.0% |
| 2008 | 18.0% | 13.0% | 18.0% |
| CST Algebra II Test | |||
| 2010 | 69.0% | 63.0% | 69.0% |
| 2009 | 75.0% | 63.0% | 65.0% |
| 2008 | 82.0% | 54.0% | 66.0% |
| CST Biology Test | |||
| 2010 | 41.0% | 35.0% | 55.0% |
| 2009 | 52.0% | 34.0% | 51.0% |
| 2008 | 48.0% | 35.0% | 52.0% |
| CST Chemistry Test | |||
| 2010 | 41.0% | 52.0% | 49.0% |
| 2009 | 47.0% | 64.0% | 44.0% |
| 2008 | 39.0% | 56.0% | 44.0% |
| CST Earth Science Test | |||
| 2010 | 7.0% | 10.0% | 35.0% |
| 2009 | 12.0% | 10.0% | 29.0% |
| 2008 | 5.0% | 5.0% | 31.0% |
| CST English-Language Arts Test | |||
| 2010 | 57.0% | 52.0% | 54.0% |
| 2009 | 50.0% | 43.0% | 50.0% |
| 2008 | 52.0% | 43.0% | 49.0% |
| CST Geometry Test | |||
| 2010 | 36.0% | 37.0% | 46.0% |
| 2009 | 45.0% | 32.0% | 47.0% |
| 2008 | 46.0% | 27.0% | 43.0% |
Grade 10 - % of students at or above proficiency
| School | District | State | |
|---|---|---|---|
| CST Algebra I Test | |||
| 2010 | 7.0% | 3.0% | 12.0% |
| 2009 | 25.0% | 5.0% | 11.0% |
| 2008 | 15.0% | 5.0% | 9.0% |
| CST Algebra II Test | |||
| 2010 | 40.0% | 28.0% | 40.0% |
| 2009 | 36.0% | 28.0% | 37.0% |
| 2008 | 22.0% | 17.0% | 36.0% |
| CST Biology Test | |||
| 2010 | 26.0% | 19.0% | 38.0% |
| 2009 | 26.0% | 16.0% | 34.0% |
| 2008 | 18.0% | 13.0% | 35.0% |
| CST Chemistry Test | |||
| 2010 | 24.0% | 26.0% | 47.0% |
| 2009 | 19.0% | 21.0% | 44.0% |
| 2008 | 17.0% | 16.0% | 41.0% |
| CST English-Language Arts Test | |||
| 2010 | 49.0% | 41.0% | 45.0% |
| 2009 | 49.0% | 40.0% | 44.0% |
| 2008 | 40.0% | 35.0% | 41.0% |
| CST Geometry Test | |||
| 2010 | 11.0% | 8.0% | 14.0% |
| 2009 | 8.0% | 5.0% | 14.0% |
| 2008 | 5.0% | 3.0% | 12.0% |
| CST Integrated Math 1 Test | |||
| 2010 | 2.0% | 2.0% | 11.0% |
| CST Integrated Math 2 Test | |||
| 2010 | 6.0% | 6.0% | 41.0% |
| CST Science Test | |||
| 2010 | 41.0% | 36.0% | 46.0% |
| 2009 | 38.0% | 33.0% | 44.0% |
| 2008 | 34.0% | 27.0% | 40.0% |
| CST Summative High School Math Test | |||
| 2010 | 81.0% | 86.0% | 75.0% |
| 2009 | 92.0% | 72.0% | 71.0% |
| 2008 | 65.0% | 53.0% | 68.0% |
| CST World History Test | |||
| 2010 | 49.0% | 37.0% | 42.0% |
| 2009 | 45.0% | 36.0% | 38.0% |
| 2008 | 33.0% | 29.0% | 33.0% |
| CST Earth Science Test | |||
| 2008 | 18.0% | 8.0% | 23.0% |
| CST Integrated/Coordinated Science Test | |||
| 2008 | 4.0% | 4.0% | 7.0% |
Grade 11 - % of students at or above proficiency
| School | District | State | |
|---|---|---|---|
| CST Algebra II Test | |||
| 2010 | 18.0% | 11.0% | 14.0% |
| 2009 | 11.0% | 6.0% | 12.0% |
| 2008 | 6.0% | 4.0% | 11.0% |
| CST Biology Test | |||
| 2010 | 77.0% | 48.0% | 46.0% |
| 2009 | 53.0% | 41.0% | 41.0% |
| 2008 | 18.0% | 28.0% | 39.0% |
| CST Chemistry Test | |||
| 2010 | 9.0% | 13.0% | 30.0% |
| 2009 | 5.0% | 10.0% | 27.0% |
| 2008 | 6.0% | 12.0% | 25.0% |
| CST Earth Science Test | |||
| 2010 | 42.0% | 38.0% | 32.0% |
| 2009 | 17.0% | 12.0% | 26.0% |
| 2008 | 6.0% | 10.0% | 28.0% |
| CST English-Language Arts Test | |||
| 2010 | 57.0% | 42.0% | 42.0% |
| 2009 | 43.0% | 36.0% | 40.0% |
| 2008 | 35.0% | 34.0% | 37.0% |
| CST Geometry Test | |||
| 2010 | 5.0% | 2.0% | 6.0% |
| 2009 | 2.0% | 3.0% | 7.0% |
| 2008 | 2.0% | 1.0% | 6.0% |
| CST Integrated Math 1 Test | |||
| 2010 | 11.0% | 11.0% | 11.0% |
| 2009 | 14.0% | 14.0% | 9.0% |
| CST Integrated Math 2 Test | |||
| 2010 | 4.0% | 4.0% | 19.0% |
| CST Integrated/Coordinated Science Test | |||
| 2010 | 29.0% | 29.0% | 8.0% |
| 2009 | 11.0% | 11.0% | 11.0% |
| CST Physics Test | |||
| 2010 | 49.0% | 39.0% | 53.0% |
| 2009 | 37.0% | 25.0% | 50.0% |
| 2008 | 34.0% | 25.0% | 47.0% |
| CST Summative High School Math Test | |||
| 2010 | 55.0% | 54.0% | 50.0% |
| 2009 | 41.0% | 36.0% | 47.0% |
| 2008 | 31.0% | 26.0% | 43.0% |
| CST U.S. History Test | |||
| 2010 | 64.0% | 48.0% | 45.0% |
| 2009 | 57.0% | 44.0% | 44.0% |
| 2008 | 42.0% | 39.0% | 38.0% |
| CST Algebra I Test | |||
| 2008 | 4.0% | 7.0% | 5.0% |
End of Course - % of students at or above proficiency
| School | District | State | |
|---|---|---|---|
| CST Algebra I Test | |||
| 2010 | 20.0% | 21.0% | 31.0% |
| 2009 | 17.0% | 19.0% | 28.0% |
| 2008 | 17.0% | 18.0% | 25.0% |
| CST Algebra II Test | |||
| 2010 | 32.0% | 23.0% | 31.0% |
| 2009 | 25.0% | 20.0% | 28.0% |
| 2008 | 19.0% | 15.0% | 27.0% |
| CST Biology Test | |||
| 2010 | 35.0% | 31.0% | 46.0% |
| 2009 | 39.0% | 29.0% | 42.0% |
| 2008 | 32.0% | 27.0% | 42.0% |
| CST Chemistry Test | |||
| 2010 | 20.0% | 23.0% | 38.0% |
| 2009 | 16.0% | 18.0% | 36.0% |
| 2008 | 14.0% | 17.0% | 32.0% |
| CST Earth Science Test | |||
| 2010 | 9.0% | 13.0% | 33.0% |
| 2009 | 12.0% | 9.0% | 28.0% |
| 2008 | 6.0% | 6.0% | 28.0% |
| CST Geometry Test | |||
| 2010 | 20.0% | 19.0% | 27.0% |
| 2009 | 15.0% | 17.0% | 26.0% |
| 2008 | 14.0% | 13.0% | 24.0% |
| CST Integrated Math 1 Test | |||
| 2010 | 6.0% | 6.0% | 13.0% |
| 2009 | 14.0% | 14.0% | 11.0% |
| CST Integrated Math 2 Test | |||
| 2010 | 5.0% | 5.0% | 27.0% |
| CST Integrated/Coordinated Science Test | |||
| 2010 | 28.0% | 28.0% | 16.0% |
| 2009 | 11.0% | 11.0% | 13.0% |
| 2008 | 3.0% | 3.0% | 11.0% |
| CST Physics Test | |||
| 2010 | 49.0% | 36.0% | 49.0% |
| 2009 | 37.0% | 25.0% | 46.0% |
| 2008 | 35.0% | 25.0% | 43.0% |
| CST Summative High School Math Test | |||
| 2010 | 60.0% | 61.0% | 54.0% |
| 2009 | 51.0% | 45.0% | 50.0% |
| 2008 | 38.0% | 34.0% | 47.0% |
| CST World History Test | |||
| 2010 | 49.0% | 36.0% | 41.0% |
| 2009 | 43.0% | 34.0% | 38.0% |
| 2008 | 33.0% | 28.0% | 33.0% |
Source: CA Department of Education 2009-2010
School Map and Similar Schools Nearby
Click to Activate Map of Nearby School Campuses
Private
Public
This School
Similar Schools Nearby
| Marshall Fundamental School 6-12 | 1,804 Students | 1.2 miles away | ![]() 4 out of 5 | |
| San Marino High School 9-12 | 1,146 Students | 2.6 miles away | Not Yet Rated | |
| Temple City High School 9-12 | 1,982 Students | 3.4 miles away | Not Yet Rated | |
| Arcadia High School 9-12 | 3,610 Students | 3.7 miles away | Not Yet Rated | |
| Roosevelt Elementary School KG-12 | 305 Students | 3.8 miles away | ![]() 5 out of 5 | |
| Blair High School 7-12 | 1,035 Students | 4.0 miles away | ![]() 5 out of 5 | |
| John Muir High School 9-12 | 1,157 Students | 4.1 miles away | Not Yet Rated | |
| Monrovia High School 9-12 | 1,737 Students | 4.4 miles away | ![]() 3.5 out of 5 | |
| San Gabriel High School 9-12 | 2,429 Students | 4.9 miles away | Not Yet Rated | |
| South Pasadena High School 9-12 | 1,518 Students | 5.0 miles away | Not Yet Rated | |
Compare This School To Nearby Schools ->
School Community Forum

Join a discussion about Pasadena High School and talk to others in the community including students, parents, teachers, and administrators.
Popular Discussion Topics
- Admissions and Registration Questions (e.g. Dress Code and Discipline Policy)
- School Calendar and Upcoming Events (e.g. Graduation)
- After School Programs, Extracurricular Activities, and Athletics (e.g. Football)
- News and Announcements (e.g. Yearbook and Class Supply List Details)
- Graduate and Alumni Events (e.g. Organizing Class Reunions)
Navigation
Can't Find What You Are Looking For?
Rankings
Nearby Cities
Sponsored Links
K-12 Articles
It's the Most Wonderful Time of the Year!
For most of the country, school is starting up this week or later this month-at the beginning of...
Simple Math ... a Simple Gift
Math affects every aspect of our lives-from balancing the checkbook to estimating the amount of...
Bullycide: What is It and How Can It Be Prevented?
Disclaimer: This article expresses my opinion that has been formed by personal experience and...


(5 / 5) 

