Mckinley School
Rating
Not Available
Not Available

No Reviews Yet
Find Old Friends From Mckinley School
Use the form below to search for alumni from Mckinley School.
School Description
School Summary and Highlights
- Enrolls 1,166 elementary school students from grades KG-8
- Ranks 1013th out of 2,050 middle schools in CA.
- 2010 Overall School AYP Met Status: Yes
Additional Contact Information
- Mailing Address: 325 South Oak Knoll Ave., Pasadena, CA 91101
School Operational Details
- Title I EligibleAll students of this school are eligible for participation in authorized programs.
School District Details
- Pasadena Unified School District
- Per-Pupil Spending: $10,241
- Graduation Rate: 61.7%
- Dropout Rate: 5.7%
- Students Per Teacher: 20.7
- Enrolled Students: 19,928
Faculty Details and Student Enrollment
Students and Faculty
- Total Students Enrolled: 1,166
- Total Full Time "Equivalent" Teachers: 51.6
- Average Student-To-Teacher Ratio: 22.6
Students Gender Breakdown
- Males: 584 (50.1%)
- Females: 582 (49.9%)
Free Lunch Student Eligibility Breakdown
- Eligible for Reduced Lunch: 137 (11.7%)
- Eligible for Free Lunch: 510 (43.7%)
- Eligible for Either Reduced or Free Lunch: 647 (55.5%)
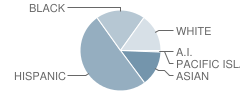
Student Enrollment Distribution by Race / Ethnicity
| Number | Percent | |
|---|---|---|
| American Indian | 6 | 0.5% |
| Black | 219 | 18.8% |
| Asian | 158 | 13.6% |
| Hispanic | 557 | 47.8% |
| White | 168 | 14.4% |
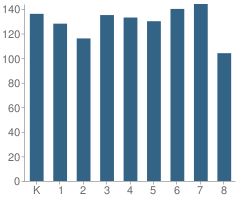
Number of Students Per Grade
| Number | Percent | |
|---|---|---|
| Kindergarten | 136 | 11.7% |
| 1st Grade | 128 | 11.0% |
| 2nd Grade | 116 | 9.9% |
| 3rd Grade | 135 | 11.6% |
| 4th Grade | 133 | 11.4% |
| 5th Grade | 130 | 11.1% |
| 6th Grade | 140 | 12.0% |
| 7th Grade | 144 | 12.3% |
| 8th Grade | 104 | 8.9% |
Teacher Education Background (2009)
Percent With Ph.D.
School:
3.6%
District:
12.5%
Percent With Master's Degree
School:
25.0%
District:
20.3%
Percent With Bachelor's Degree
School:
10.7%
District:
3.1%
Teacher Credentials & Experience (2009)
Percent of Teachers With Credentials: 98.1%
Number of Certificated Staff: 56.0
Average Number of Years of Teacher Experience: 10.3
Average Age
School:
38.9
District:
47.8
Source: CA Department of Education, Source: NCES 2009-2010
School Ratings and Reviews
Be The First To Review Mckinley School!
School Map and Similar Schools Nearby
Click to Activate Map of Nearby School Campuses
Private
Public
This School
Similar Schools Nearby
| Madison Elementary School KG-5 | 505 Students | 1.2 miles away |  5 out of 5 | |
| Jefferson Elementary School KG-5 | 595 Students | 1.3 miles away | Not Yet Rated | |
| Roosevelt Elementary School KG-12 | 305 Students | 1.5 miles away | 5 out of 5 | |
| Hamilton Elementary School KG-6 | 586 Students | 1.6 miles away | Not Yet Rated | |
| Valentine Elementary School KG-5 | 635 Students | 1.9 miles away | Not Yet Rated | |
| Longfellow (Henry W.) Elementary School KG-6 | 525 Students | 2.0 miles away | Not Yet Rated | |
| San Rafael Elementary School KG-6 | 348 Students | 2.2 miles away | Not Yet Rated | |
| Washington Accelerated Elementary School KG-5 | 747 Students | 2.2 miles away | Not Yet Rated | |
| Marengo Elementary School KG-5 | 640 Students | 2.3 miles away | Not Yet Rated | |
| Norma Coombs Alternative School KG-8 | 575 Students | 2.4 miles away |  4.5 out of 5 | |
Compare This School To Nearby Schools ->
School Community Forum

Join a discussion about Mckinley School and talk to others in the community including students, parents, teachers, and administrators.
Popular Discussion Topics
- Admissions and Registration Questions (e.g. Dress Code and Discipline Policy)
- School Calendar and Upcoming Events (e.g. Graduation)
- After School Programs, Extracurricular Activities, and Athletics (e.g. Football)
- News and Announcements (e.g. Yearbook and Class Supply List Details)
- Graduate and Alumni Events (e.g. Organizing Class Reunions)
Navigation
Can't Find What You Are Looking For?
Rankings
Nearby Cities
Sponsored Links
K-12 Articles

Adolescents, Sleep and Learning
Recently, adolescent's sleep habits have been in the news. Research has shown that adolescents need...
Recently, adolescent's sleep habits have been in the news. Research has shown that adolescents need...

Assisting Students to Overcome Test Anxiety
Every human copes with anxiety at one time or another. It is a basic emotion that we feel when...
Every human copes with anxiety at one time or another. It is a basic emotion that we feel when...

All About Backpacks
Your child riffles through his backpack to find homework assignments, his MP3 player, lunch money...
Your child riffles through his backpack to find homework assignments, his MP3 player, lunch money...